Rewards
Futures Daily Draw
100% Chance To Win With Daily Trades
現物の日次のドロー
Win 8,888 USDT In Grand Prizes
ステークして投票
投票してエアドロップを獲得
機関
プロなかつ専門的なサービス対応
BitMart VIP
限定報酬のロック解除
アカデミー
トレードとブロックチェーンについて
BitMart Internship
Start your Crypto Career Here
BitMart Travel
ワンストップグローバルトラベルサービス
モバイルチャージ
モバイルを簡単に、オンラインで、安全にチャージ
Send
Send money globally, fast and secure
BitMartモール
Live on crypto

The Graph ライブ価格データ
The Graphの今日の価格は$ 0.020 (GRT/USD)です。 時価総額$ 216.87M USD、 24時間取引量$ 688.90K USD、 24時間の価格変動+2.39%、 そして流通供給量10.84B GRT。
The Graph GRT 価格履歴 USD
The Graphの今日、7日間、30日間、90日間の価格を追跡
期間
24H変動幅
24H変動率 (%)
本日
$ 0.00046
2.37%
7日
$ 0.0056
-21.97%
30日
$ 0.0059
-22.91%
90日
$ 0.0046
-19.03%
GRTを今すぐ所有
BitMartでGRTを簡単に安全に売買できます。
The Graph 相場情報
$ 0.019 24H変動幅 $ 0.020
過去最高値
$ 2.88
過去最安値
$ 0.00098
24H変動幅
2.39%
24H取引高
$ 688,901.25
供給量
10.84B
GRT
時価総額
$ 216.87M
最大供給量
--
完全希薄化後時価総額
$ 231.08M
取引 GRT

The Graph Xインサイト

Blockster
Media
Influencer
A
 83.2K @BlocksterCom
 強気
The Graph (GRT) is expected to drive enterprise blockchain adoption, with a promising outlook.

The Graph D
340.6K @graphprotocol The reason enterprise adoption moves slowly is not skepticism about the technology. It is the gap between what blockchain can do and what regulated institutions are allowed to touch.
SOC-2 compliance. Verified node operators. Auditable data.
"The Graph's roadmap seeks to address that, and I'm super optimistic that The Graph will be part of that conversation." - Nick, Team Lead
 118
118
 11
11
 11.0K
11.0K
2026-06-02 14:31
リリース後のGRTのトレンド
強気
The Graph (GRT) is expected to drive enterprise blockchain adoption, with a promising outlook.

BigRugSznMike
TA_Analyst
Trader
C
25.0K @Michael_EWpro 強気
The author predicts GRT will complete a correction and then see a significant rise, target "20 bands".
looks like a possible running or irregular flat on ethereum:0xc944e90c64b2c07662a292be6244bdf05cda44a7 H4 https://t.co/iHNLGq6wJI
BigRugSznMike
TA_Analyst
Trader
C
25.0K @Michael_EWpro Next up 20 bands into ethereum:0xc944e90c64b2c07662a292be6244bdf05cda44a7 let the haters keep fading me and ima keep winning
8
2
2.3K
2026-05-31 21:27
リリース後のGRTのトレンド
強気
The author predicts GRT will complete a correction and then see a significant rise, target "20 bands".

IncomeSharks
TA_Analyst
Trader
C
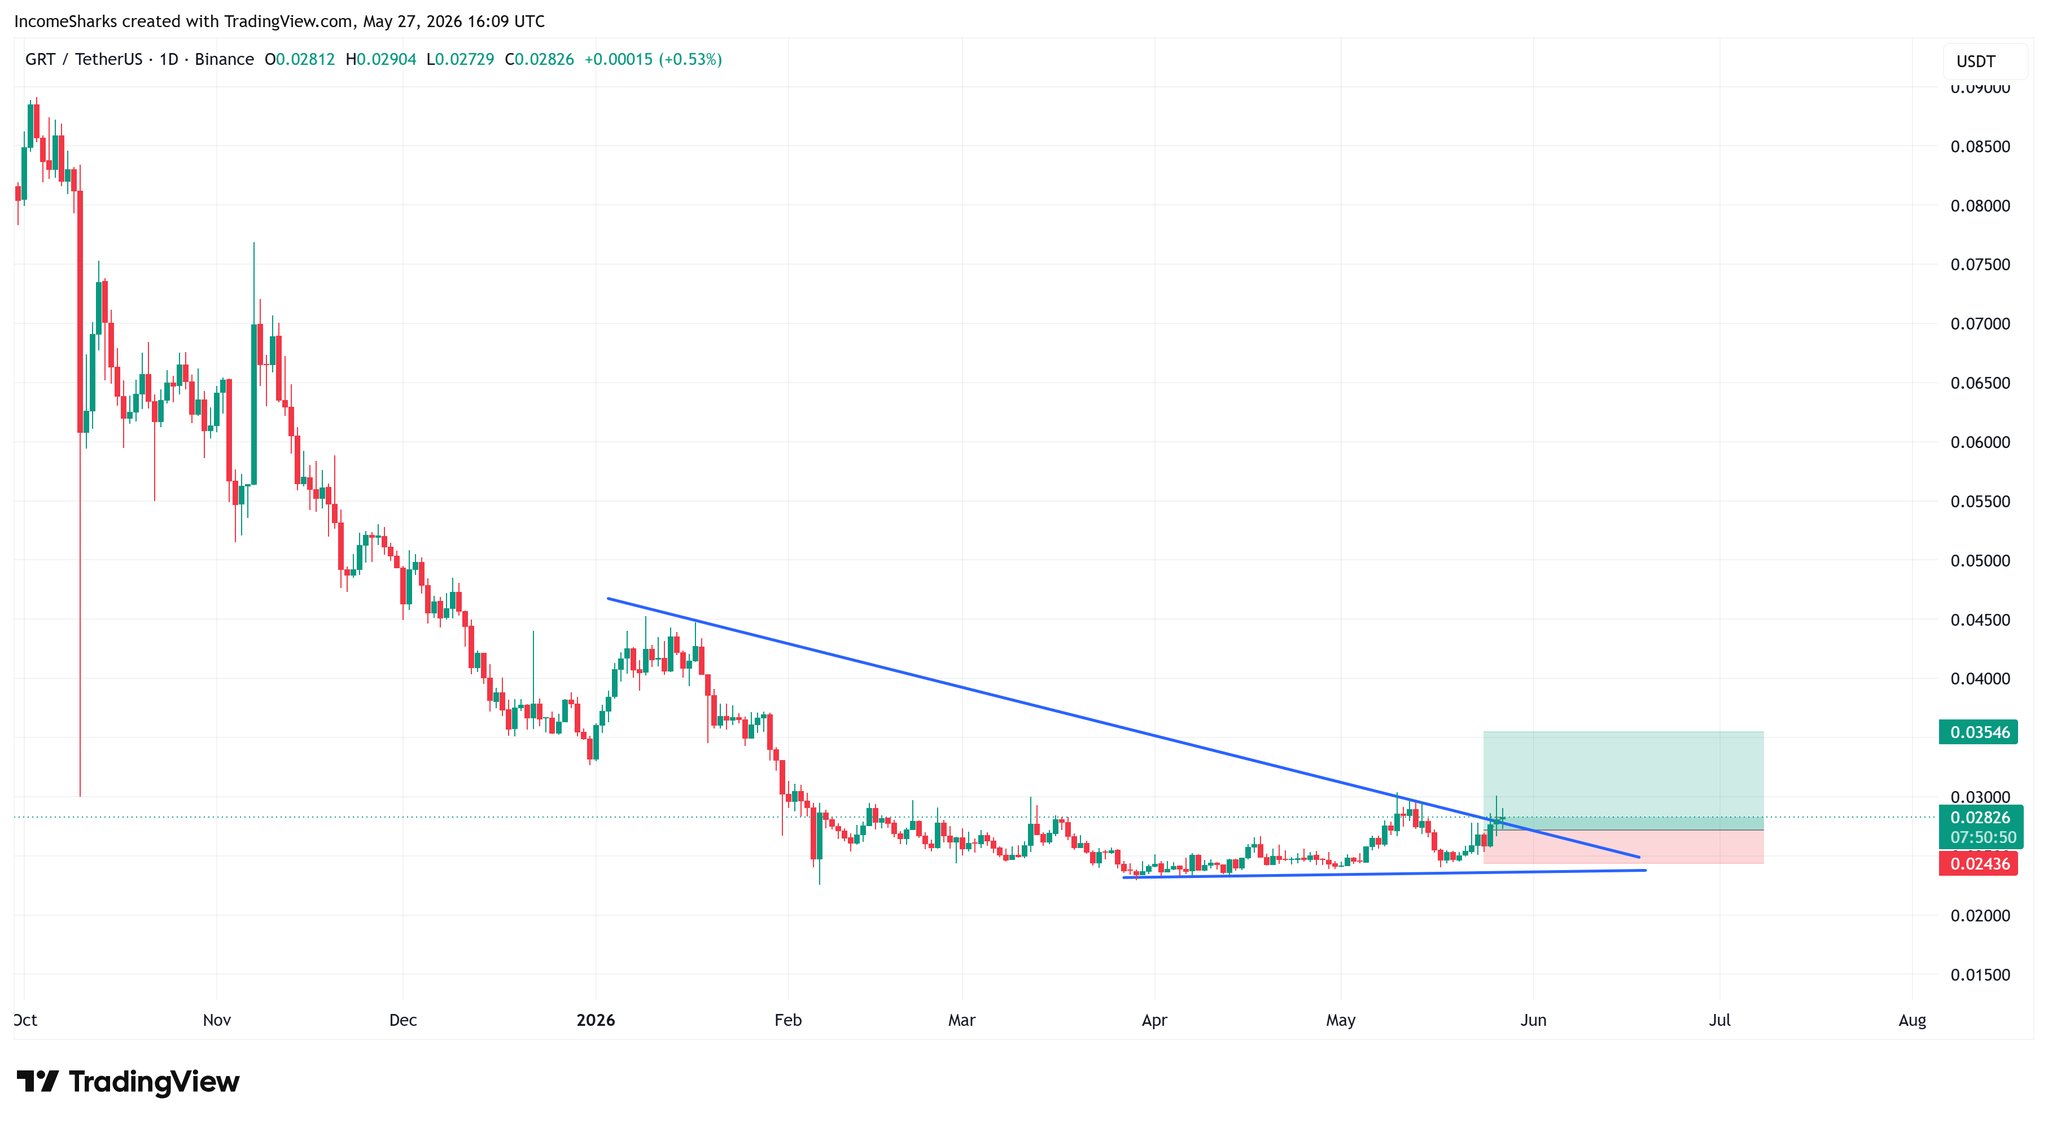
744.7K @IncomeSharks 強気
The GRT technical chart shows a clear breakout; the author recommends trading based on technical analysis and emphasizes risk management.
$GRT - If this was a stock I wouldn't hesitate to bid but because it's crypto it feels more hesitant. Pretty clean break out, purely TA play with easy invalidation if it doesn't work out. https://t.co/OYlG5kWbgk
IncomeSharks
TA_Analyst
Trader
C
744.7K @IncomeSharks Every time I want to dip my toes back into crypto I'm reminded why staying in stocks is better. If this was a Stock it'd be up 30% today. https://t.co/OHJ3ys4TsR
 385
45
57.6K
385
45
57.6K
2026-05-27 16:37
リリース後のGRTのトレンド
強気
The GRT technical chart shows a clear breakout; the author recommends trading based on technical analysis and emphasizes risk management.
価格予測
GRTを購入するのに良い時期はいつですか?GRTは今買いでしょうか、売りでしょうか?
The Graph(GRT)を購入または売却する適切な時期を決定する際は、まずご自身の取引戦略とリスクプロファイルに合わせることが重要です。長期投資家と短期トレーダーは市場状況を異なる方法で解釈することが多いため、決定には個人的なアプローチを反映すべきです。 最新の GRT 4時間テクニカル分析によると、現在の取引シグナルは ホールド です。 最新のGRT1日テクニカル分析によると、現在のシグナルは購入です。

ビーコン予測
の確率的価格予測(今後24時間)ビーコン予測に関する免責事項
このページに表示されるデータ結果は、選択した取引ペアの実際の取引データ(OHLCV)と対応するテクニカル指標に基づいて分析されています。
この予測は実験的な技術的成果であり、あくまで参考目的で提供しています。これは投資アドバイスをではありません。現実世界での予期せぬ出来事が市場行動に大きな影響を与える可能性があります。トレーダーは慎重に意思決定を行うべきです。
この予測は実験的な技術的成果であり、あくまで参考目的で提供しています。これは投資アドバイスをではありません。現実世界での予期せぬ出来事が市場行動に大きな影響を与える可能性があります。トレーダーは慎重に意思決定を行うべきです。
アプリバージョン The Graph
The Graph (GRT) is a cryptocurrency launched in 2018and operates on the Ethereum platform. The Graph has a current supply of 11,551,760,000.429121 with 10,841,335,000.429329 in circulation. The last known price of The Graph is 0.02581323 USD and is down -1.90 over the last 24 hours. It is currently trading on 619 active market(s) with $19,142,969.84 traded over the last 24 hours. More information can be found at https://thegraph.com.
続きを読む
さらに詳しく
BM Discovery


新規上場

ISK$ Iskander Coin
-- 0.00%

$BLAST SafeBLAST
-- 0.00%

SPYON SPDR S&P 500 Tokenized ETF (Ondo)
-- 0.00%

QQQON Invesco QQQ Tokenized ETF (Ondo)
-- 0.00%

MCDON McDonald's Tokenized Stock (Ondo)
-- 0.00%

MSTRON MicroStrategy Tokenized Stock (Ondo)
-- 0.00%

AVGOON Broadcom Tokenized Stock (Ondo)
-- 0.00%

CRCLON Circle Internet Group Tokenized Stock (Ondo)
-- 0.00%

COINON Coinbase Tokenized Stock (Ondo)
-- 0.00%

NFLXON Netflix Tokenized Stock (Ondo)
-- 0.00%
購入 GRT
取引 GRT