口座開設
QRコードでアプリをダウンロードする
iOS & Android

Steem (STEEM)

$
$ 0.039 (STEEM/USD)
0.00%
24H

Steem ライブ価格データ

Steemの今日の価格は$ 0.039 (STEEM/USD)です。 時価総額$ 21.96M USD 24時間取引量$ 5.90M USD 24時間の価格変動+0.00% そして流通供給量549.45M STEEM

Steem STEEM 価格履歴 USD

Steemの今日、7日間、30日間、90日間の価格を追跡
期間
24H変動幅
24H変動率 (%)
本日
$ 0
0.00%
7日
$ 0.0099
-20.00%
30日
$ 0.019
-33.33%
90日
$ 0.019
-33.33%

STEEMを今すぐ所有

BitMartでSTEEMを簡単に安全に売買できます。
今すぐSTEEMを購入/売却
今すぐ{0}を購入/売却
Steem 相場情報
最終取引価格 $ 0.039
$ 0.039 24H変動幅 $ 0.049
過去最高値
‎$ 0.079‎
過去最安値
‎$ 0.039‎
24H変動幅
‎0.00%‎
24H取引高
‎$ 5,903,195.83‎
供給量
0.54B STEEM
時価総額
‎$ 21.96M‎
最大供給量
--
完全希薄化後時価総額
‎$ 21.96M‎
取引 STEEM

稼ぐ

眠っている暗号資産を活用し、セービングやステーキングで安定収益を獲得。
今すぐ試す
今すぐ試す

Steem Xインサイト

avatar
STEEM technical analysis bullish, target $0.0728-$0.0812.

Why $STEEM Looks Ready For A Clean Run Toward Upside Liquidity

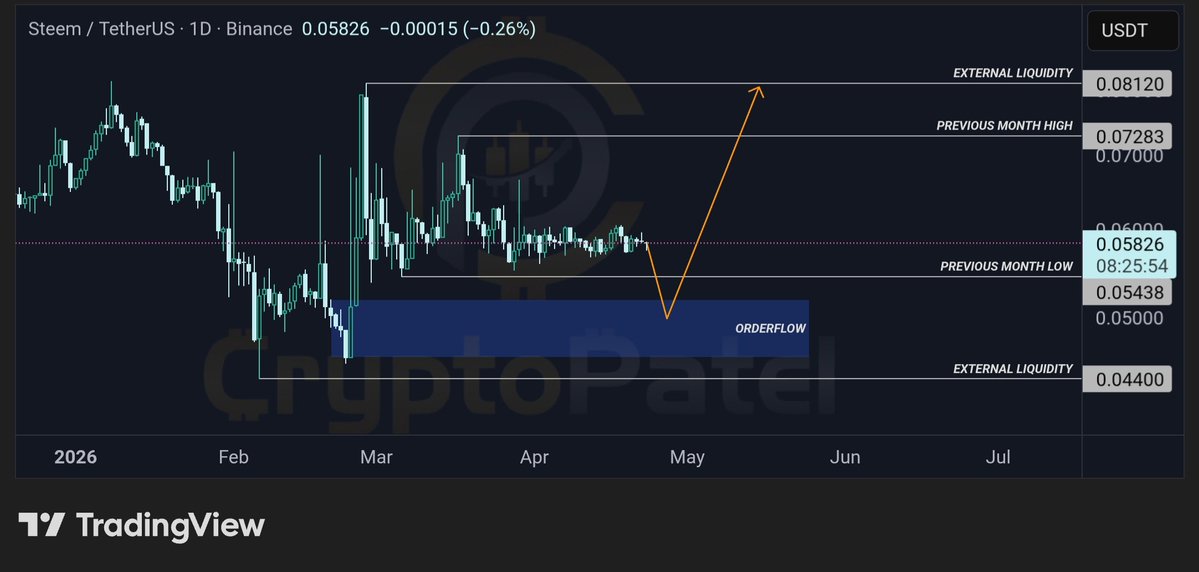
#STEEM is moving within a clear accumulation range, with liquidity resting below previous month low and a strong orderflow zone supporting bullish continuation toward upside liquidity.

Technical Structure:
✅ Accumulation range → bullish base formation
✅ Previous month low → liquidity sweep setup
✅ Strong orderflow zone → demand support
✅ Compression building → impulsive expansion potential
✅ Liquidity above → clear upside targets

Targets: $0.0728 → $0.0812
Invalidation: 1D close below $0.04578

Bullish bias. Wait for liquidity sweep below previous month low and confirmation before entering toward buy-side liquidity.

TA Only. DYOR.

view 236
view 13
view 6.9K
2026-04-24 07:33
リリース後のSTEEMのトレンド
非常に強気
STEEM technical analysis bullish, target $0.0728-$0.0812.
avatar
The author questions the legitimacy of STEEM, believing that its high trading volume cannot prevent it from being delisted.

It's 2026 and $STEEM is doing $120 million in 24H volume. How is $STEEM not delisted everywhere? https://t.co/1AvfyLqul1

view 0
view 0
view 218
2026-02-25 01:12
リリース後のSTEEMのトレンド
非常に弱気
The author questions the legitimacy of STEEM, believing that its high trading volume cannot prevent it from being delisted.
avatar
STEEM's short-term rise is a liquidity trap, it is in a downtrend channel, historical data shows that after being overbought it has sharply pulled back, and the author is short.

🔔 $STEEM Now | Market Watch

$STEEM ’s short-term spike is pulling retail straight into a liquidity trap.

Every time $STEEM has pushed into overbought territory, a pullback followed.

The broader structure still looks weak, with price moving inside a downtrend channel.

I’m positioned short on $STEEM.

Not financial advice.DYOR

view 501
view 103
view 73.6K
2026-03-05 04:18
リリース後のSTEEMのトレンド
非常に弱気
STEEM's short-term rise is a liquidity trap, it is in a downtrend channel, historical data shows that after being overbought it has sharply pulled back, and the author is short.
詳細確認

価格予測

STEEMを購入するのに良い時期はいつですか?STEEMは今買いでしょうか、売りでしょうか?

Steem(STEEM)を購入または売却する適切な時期を決定する際は、まずご自身の取引戦略とリスクプロファイルに合わせることが重要です。長期投資家と短期トレーダーは市場状況を異なる方法で解釈することが多いため、決定には個人的なアプローチを反映すべきです。 最新の STEEM 4時間テクニカル分析によると、現在の取引シグナルは ホールド です。 最新のSTEEM1日テクニカル分析によると、現在のシグナルはホールドです。
46
ホールド
STEEMの4時間テクニカル分析
最終更新 2026-06-10 11:59:59
56
ホールド
STEEMの1日間テクニカル分析
最終更新 2026-06-09 23:59:59
beacon

ビーコン予測

の確率的価格予測(今後24時間)
i
ビーコン予測に関する免責事項
このページに表示されるデータ結果は、選択した取引ペアの実際の取引データ(OHLCV)と対応するテクニカル指標に基づいて分析されています。
この予測は実験的な技術的成果であり、あくまで参考目的で提供しています。これは投資アドバイスをではありません。現実世界での予期せぬ出来事が市場行動に大きな影響を与える可能性があります。トレーダーは慎重に意思決定を行うべきです。
アプリバージョン Steem
Steem (STEEM) is a cryptocurrency launched in 2016. Steem has a current supply of 549,454,367.277. The last known price of Steem is 0.04510764 USD and is down -0.12 over the last 24 hours. It is currently trading on 105 active market(s) with $4,031,600.21 traded over the last 24 hours. More information can be found at https://steem.com/.
続きを読む