口座開設
QRコードでアプリをダウンロードする
iOS & Android

Celestia (TIA)

$
$ 0.29 (TIA/USD)
-3.50%
24H

Celestia ライブ価格データ

Celestiaの今日の価格は$ 0.29 (TIA/USD)です。 時価総額$ 271.17M USD 24時間取引量$ 1.58M USD 24時間の価格変動-3.63% そして流通供給量919.93M TIA

Celestia TIA 価格履歴 USD

Celestiaの今日、7日間、30日間、90日間の価格を追跡
期間
24H変動幅
24H変動率 (%)
本日
$ 0.010
-3.50%
7日
$ 0.11
-28.27%
30日
$ 0.082
-21.97%
90日
$ 0.024
-7.56%

TIAを今すぐ所有

BitMartでTIAを簡単に安全に売買できます。
今すぐTIAを購入/売却
今すぐ{0}を購入/売却
Celestia 相場情報
最終取引価格 $ 0.29
$ 0.27 24H変動幅 $ 0.30
過去最高値
‎$ 21.05‎
過去最安値
‎$ 0.23‎
24H変動幅
‎-3.63%‎
24H取引高
‎$ 1,584,036.35‎
供給量
0.92B TIA
時価総額
‎$ 271.17M‎
最大供給量
--
完全希薄化後時価総額
‎$ 344.50M‎
取引 TIA

稼ぐ

眠っている暗号資産を活用し、セービングやステーキングで安定収益を獲得。
今すぐ試す
今すぐ試す

Celestia Xインサイト

avatar
TIA is testing the critical support zone of $0.28-0.30, and a break below $0.28 could set a new low.

$TIA 0.28-030$ we need a reversal from these levels; if the close is below $0.28 the price will make a new low. I'm watching above $0.28.. https://t.co/0yXDCfPaNC
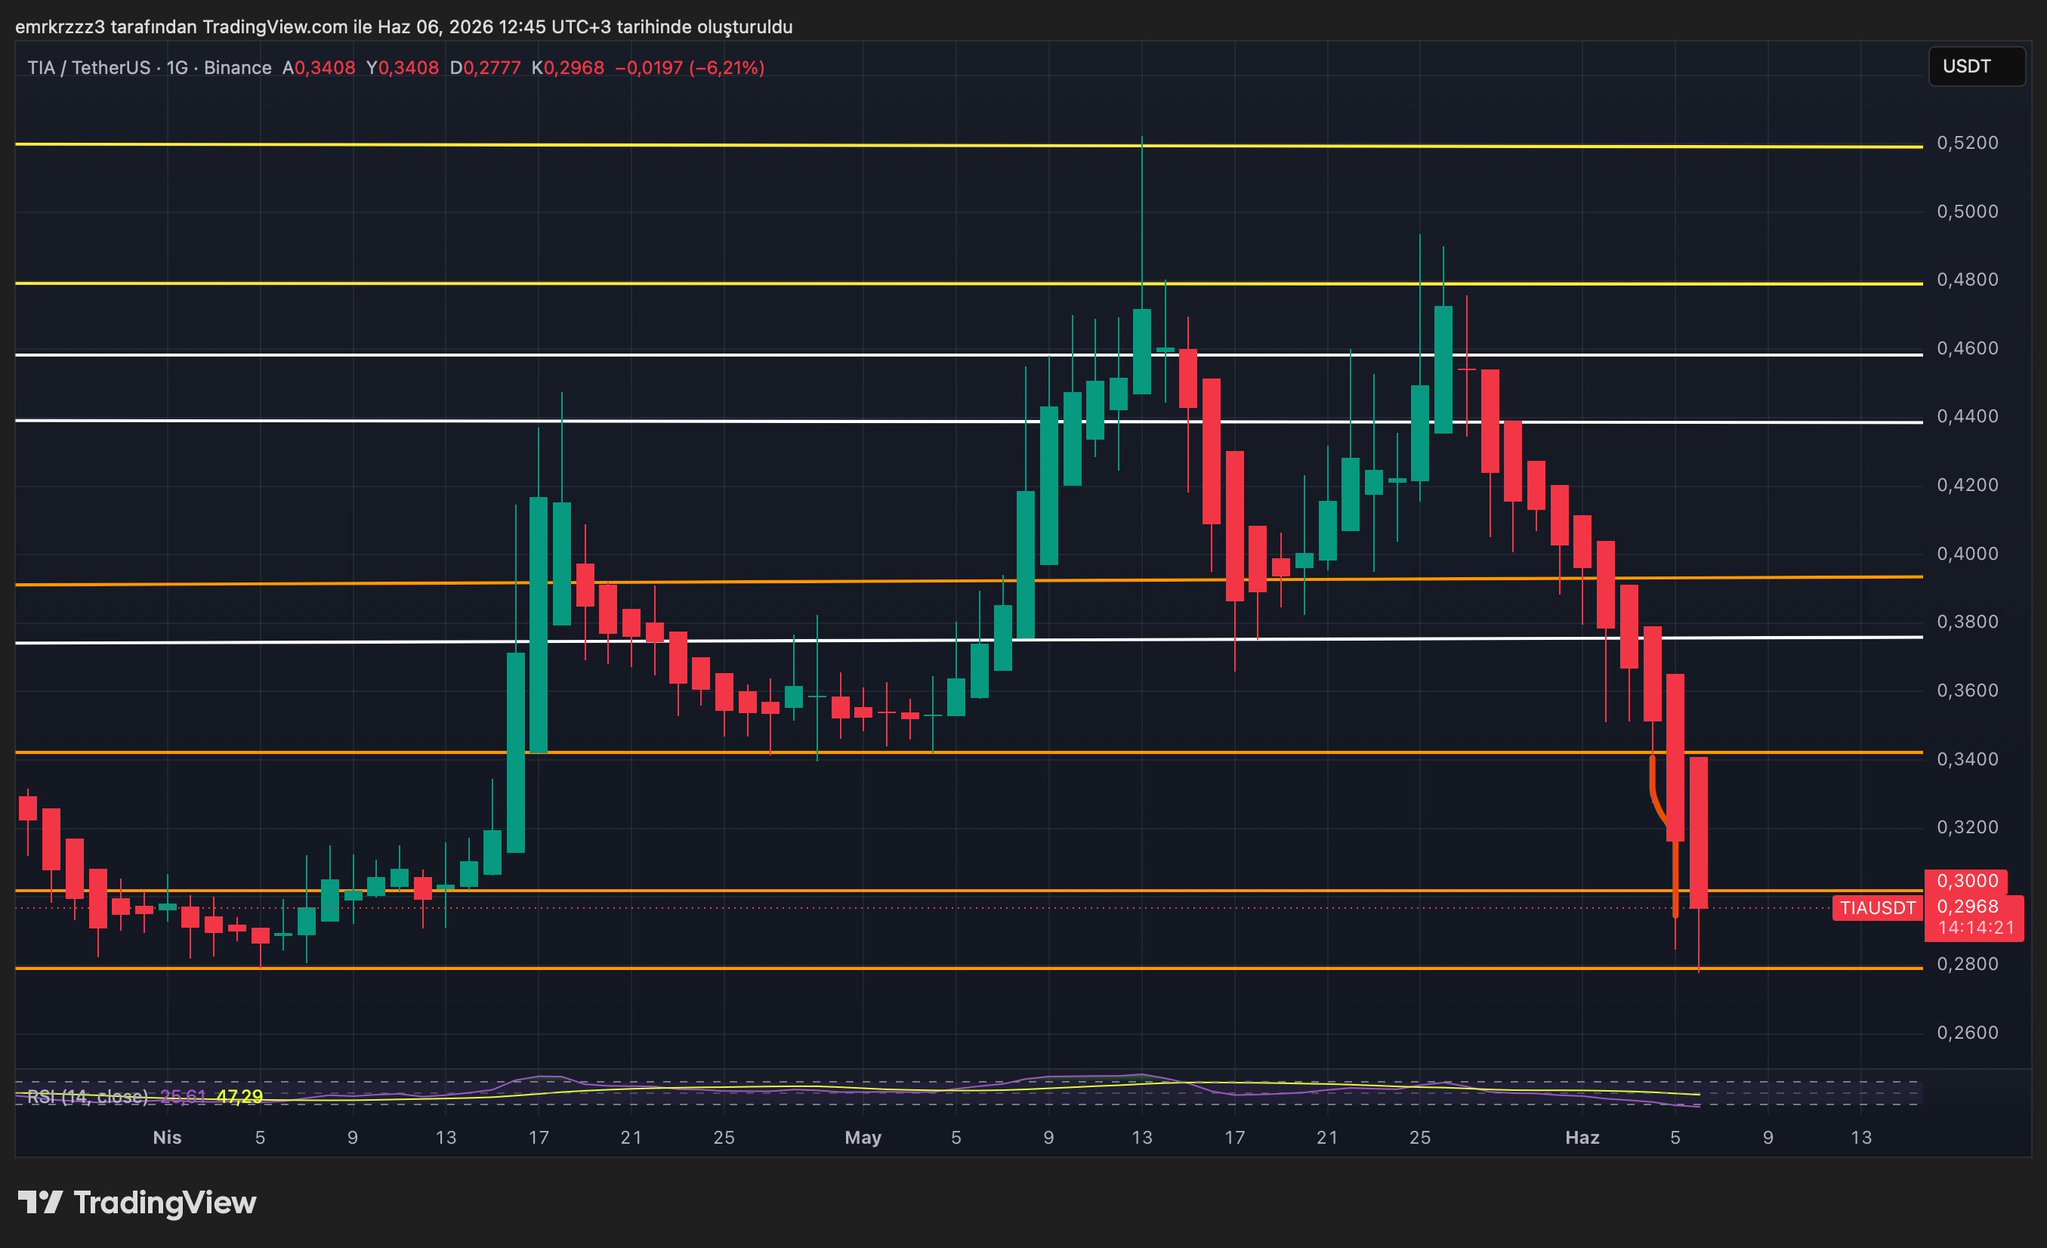
view 34
view 2
view 835
2026-06-06 09:48
リリース後のTIAのトレンド
弱気
TIA is testing the critical support zone of $0.28-0.30, and a break below $0.28 could set a new low.
avatar
TIA has dropped 98.4% and its market cap is only $350 million, outlook bearish

Celestia is down 98.4% and still 350mn mcap

We deserve the dump tbh

view 206
view 14
view 25.4K
2026-06-04 21:27
リリース後のTIAのトレンド
弱気
TIA has dropped 98.4% and its market cap is only $350 million, outlook bearish
avatar
TIA broke key support, technical analysis suggests it may drop to lower prices, and weekly support should be watched.

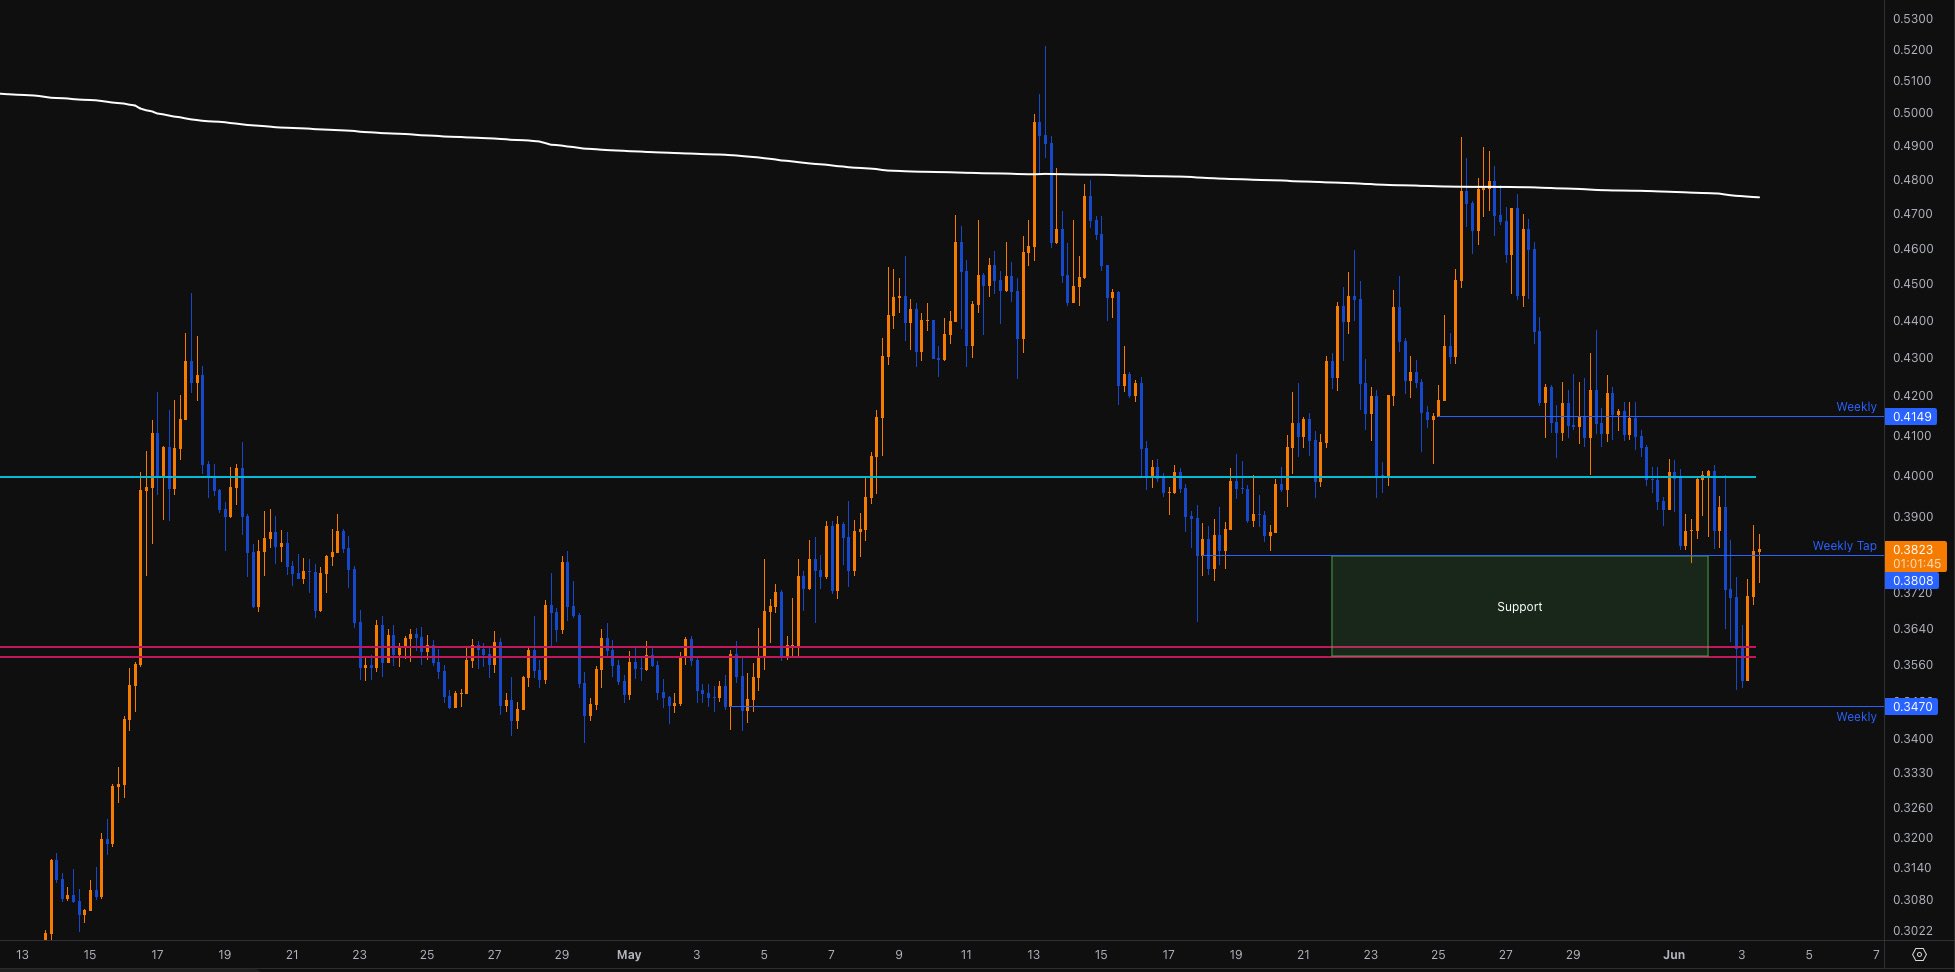
$TIA (4h) visited both POCs, but spend time there with few 4h candles closing below confirming (potential) MS change which opens the doors to lower prices.
The Weekly at $0.415 also has a POC for (very local) volume profile and AVWAP from last LH. So could be a resistance.
As support we could observe what happens around the lower Weekly ($0.347) and these lows around May 1st 🧐

view 4
view 0
view 414
2026-06-03 16:17
リリース後のTIAのトレンド
弱気
TIA broke key support, technical analysis suggests it may drop to lower prices, and weekly support should be watched.
詳細確認

価格予測

TIAを購入するのに良い時期はいつですか?TIAは今買いでしょうか、売りでしょうか?

Celestia(TIA)を購入または売却する適切な時期を決定する際は、まずご自身の取引戦略とリスクプロファイルに合わせることが重要です。長期投資家と短期トレーダーは市場状況を異なる方法で解釈することが多いため、決定には個人的なアプローチを反映すべきです。 最新の TIA 4時間テクニカル分析によると、現在の取引シグナルは ホールド です。 最新のTIA1日テクニカル分析によると、現在のシグナルは購入です。
55
ホールド
TIAの4時間テクニカル分析
最終更新 2026-06-06 15:59:59
65
購入
TIAの1日間テクニカル分析
最終更新 2026-06-07 00:00:00
beacon

ビーコン予測

の確率的価格予測(今後24時間)
i
ビーコン予測に関する免責事項
このページに表示されるデータ結果は、選択した取引ペアの実際の取引データ(OHLCV)と対応するテクニカル指標に基づいて分析されています。
この予測は実験的な技術的成果であり、あくまで参考目的で提供しています。これは投資アドバイスをではありません。現実世界での予期せぬ出来事が市場行動に大きな影響を与える可能性があります。トレーダーは慎重に意思決定を行うべきです。
アプリバージョン Celestia
Celestia (TIA) is a cryptocurrency launched in 2023and operates on the Osmosis platform. Celestia has a current supply of 1,168,685,161.483695 with 919,932,996.62251 in circulation. The last known price of Celestia is 0.39383101 USD and is down -3.57 over the last 24 hours. It is currently trading on 354 active market(s) with $27,084,698.86 traded over the last 24 hours. More information can be found at https://www.celestia.org.
続きを読む
購入 TIA
取引 TIA