Comprar criptomoedas
cartão
Negociação P2P
Compre USDT via marketplace
Cartão de Crédito/Débito
Compre criptomoedas com Visa ou Mastercard
Pagamento de terceiros
Compre criptomoedas pela MoonPay, Simplex e outras
Cartão BitMart
Fortalecendo sua jornada no mundo cripto
Cartão Pré-pago de Cripto
Obtenha seu Mastercard utilizável na hora
USDⓈ-M
Usando USDⓈ como garantia
COIN-M
Usando a própria MOEDA como garantia
TradFi
Negociação em um só lugar para metais, ações e forex
Demo de Trading
Aprenda a negociar sem risco
Visão geral dos Futuros
Plataforma única para tudo o que é relacionados aos Futuros
Futures King
478.000 USDT em prêmios
Evoluir
Visão Geral do Earn
Ativos Parados, Ganhos com Facilidade no Earn
Economia
Ganhe juros com participações
Apostando
Aposta fácil, recompensas altas
Gestão de Patrimônio
Evolua seu patrimônio com uma equipe de ativos de alto nível
RWA
Mantenha BMRUSD e Aproveite os Rendimentos
Exclusivo VIP
Ganhos de forma estável para usuários VIP
Rewards
Hub de recompensas
Descubra recompensas exclusivas de até 14.000 USDT
LaunchPrime
Uma plataforma de lançamento de token e NFT
Programa de Afiliados
Entre para ganhar altas comissões
Powerdrop
A Solução de Última Geração para Airdrops já está DISPONÍVEL!
Centro de eventos
Seu Hub para Todas as Operações Comerciais
Sorteio Diário de Futuros
Chance de ganhar em todas as negociações diárias
Sorteio diário Spot
Ganhe 8.888 USDT em Prêmios Incríveis
Stake to vote
Ganhe airdrops votando
Instituição
Serviços profissionais e exclusivos
VIP
Desbloquear recompensas exclusivas
Academia
Aprenda rapidamente sobre trading e blockchain
Estágio na BitMart
Comece sua carreira em cripto aqui
BitMart Travel
Serviços globais de viagem em um só lugar
INO
Uma plataforma de lançamento de NFTs
Faça Stake de BMX para Listagem
Compartilhar taxas de transação
APIS
Estabilidade robusta e inúmeros terminais
Programa de Corretores
Ganhe comissões pela integração da API
Notícias
Últimas notícias e visualizações
NFT MARKETPLACE
Um mercado de NFT como nenhum outro
Recarga de Celular
Recarregue celulares online de forma fácil e segura
Send
Send money globally, fast and secure
BitMart Mall
Viva com cripto

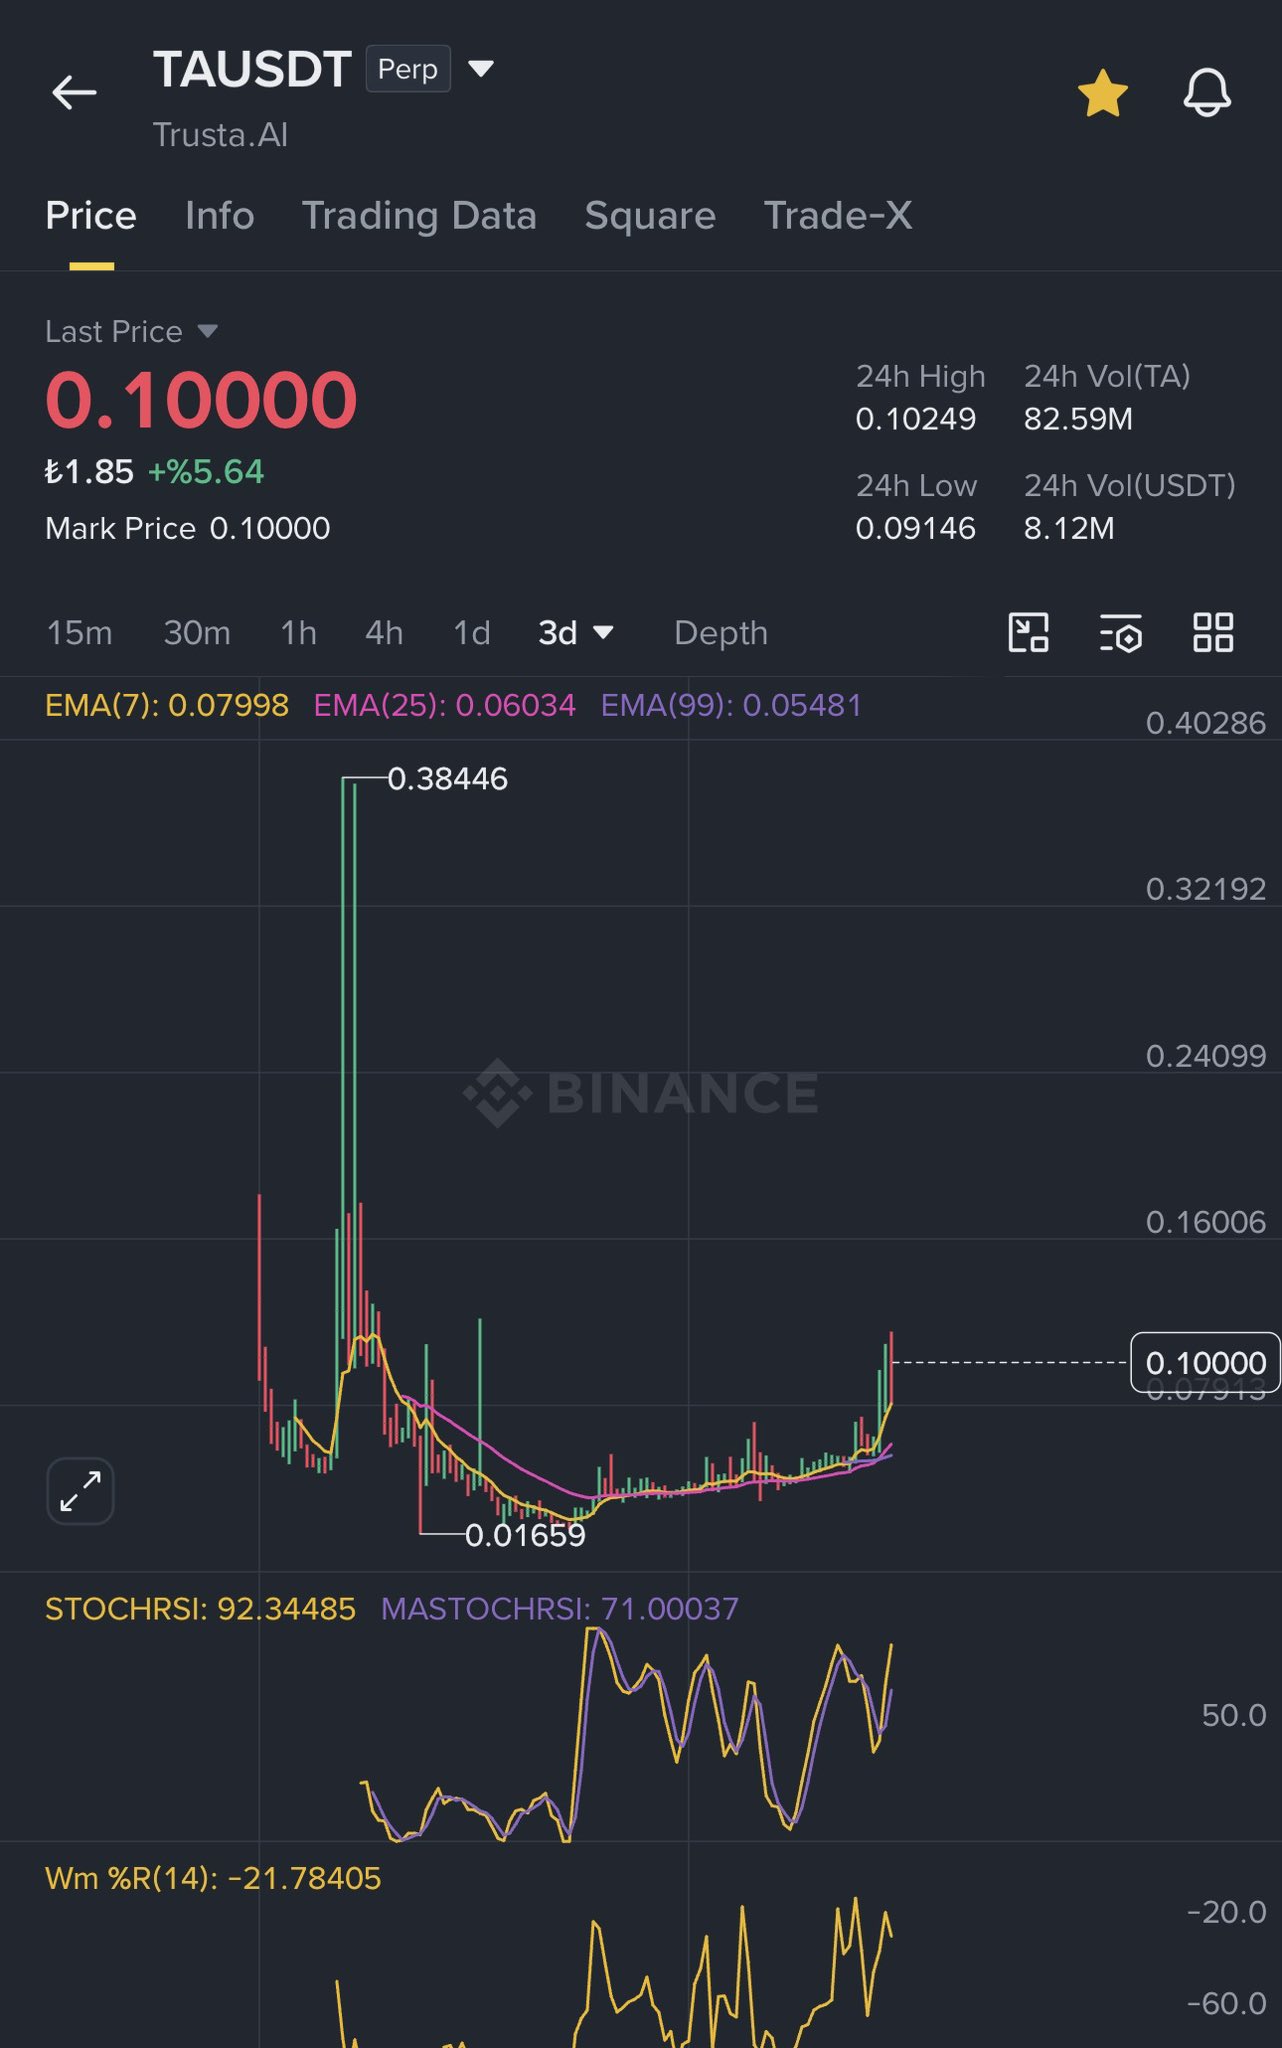
Trusta.AI Dados de preços ao vivo
O preço atual de Trusta.AI é $ 0.071 (TA/USD). Com um Market Cap de $ 22.13M USD, Volume de Trading em 24 horas de $ 632.34K USD, Uma Variação de Preço em 24 horas de -9.46%, E um Fornecimento Circulante de 309.31M TA.
Trusta.AI TA Histórico de Preços USD
Acompanhe o preço de Trusta.AI hoje e nos últimos 7, 30 e 90 dias
Período
Mudar
Alterar (%)
Hoje
$ 0.0077
-9.77%
7Dias
$ 0.024
-25.62%
30Dias
$ 0.019
36.66%
90Dias
$ 0.027
63.20%
Adquira TA agora
Compre e venda TA de forma fácil e segura na BitMart.
Trusta.AI Informações de mercado
$ 0.071 Intervalo de 24h $ 0.080
Máximo histórico
$ 0.38
Mínimo histórico
$ 0.0056
Alteração 24h
-9.46%
24h Vol
$ 632,338.85
Fornecimento circulante
217.50M
TA
Capitalização de mercado
$ 15.56M
Fornecimento máximo
1.00B
TA
Capitalização de mercado totalmente diluída
$ 71.54M
Comércio TA
Ganhar
Coloque suas criptomoedas ociosas para trabalhar e ganhe renda passiva com poupança, staking e muito mais.
Trusta.AI X Insight

Crypto Tolga
TA_Analyst
Trader
B
 79.1K @CryptoTolga_
 Extremamente Bullish
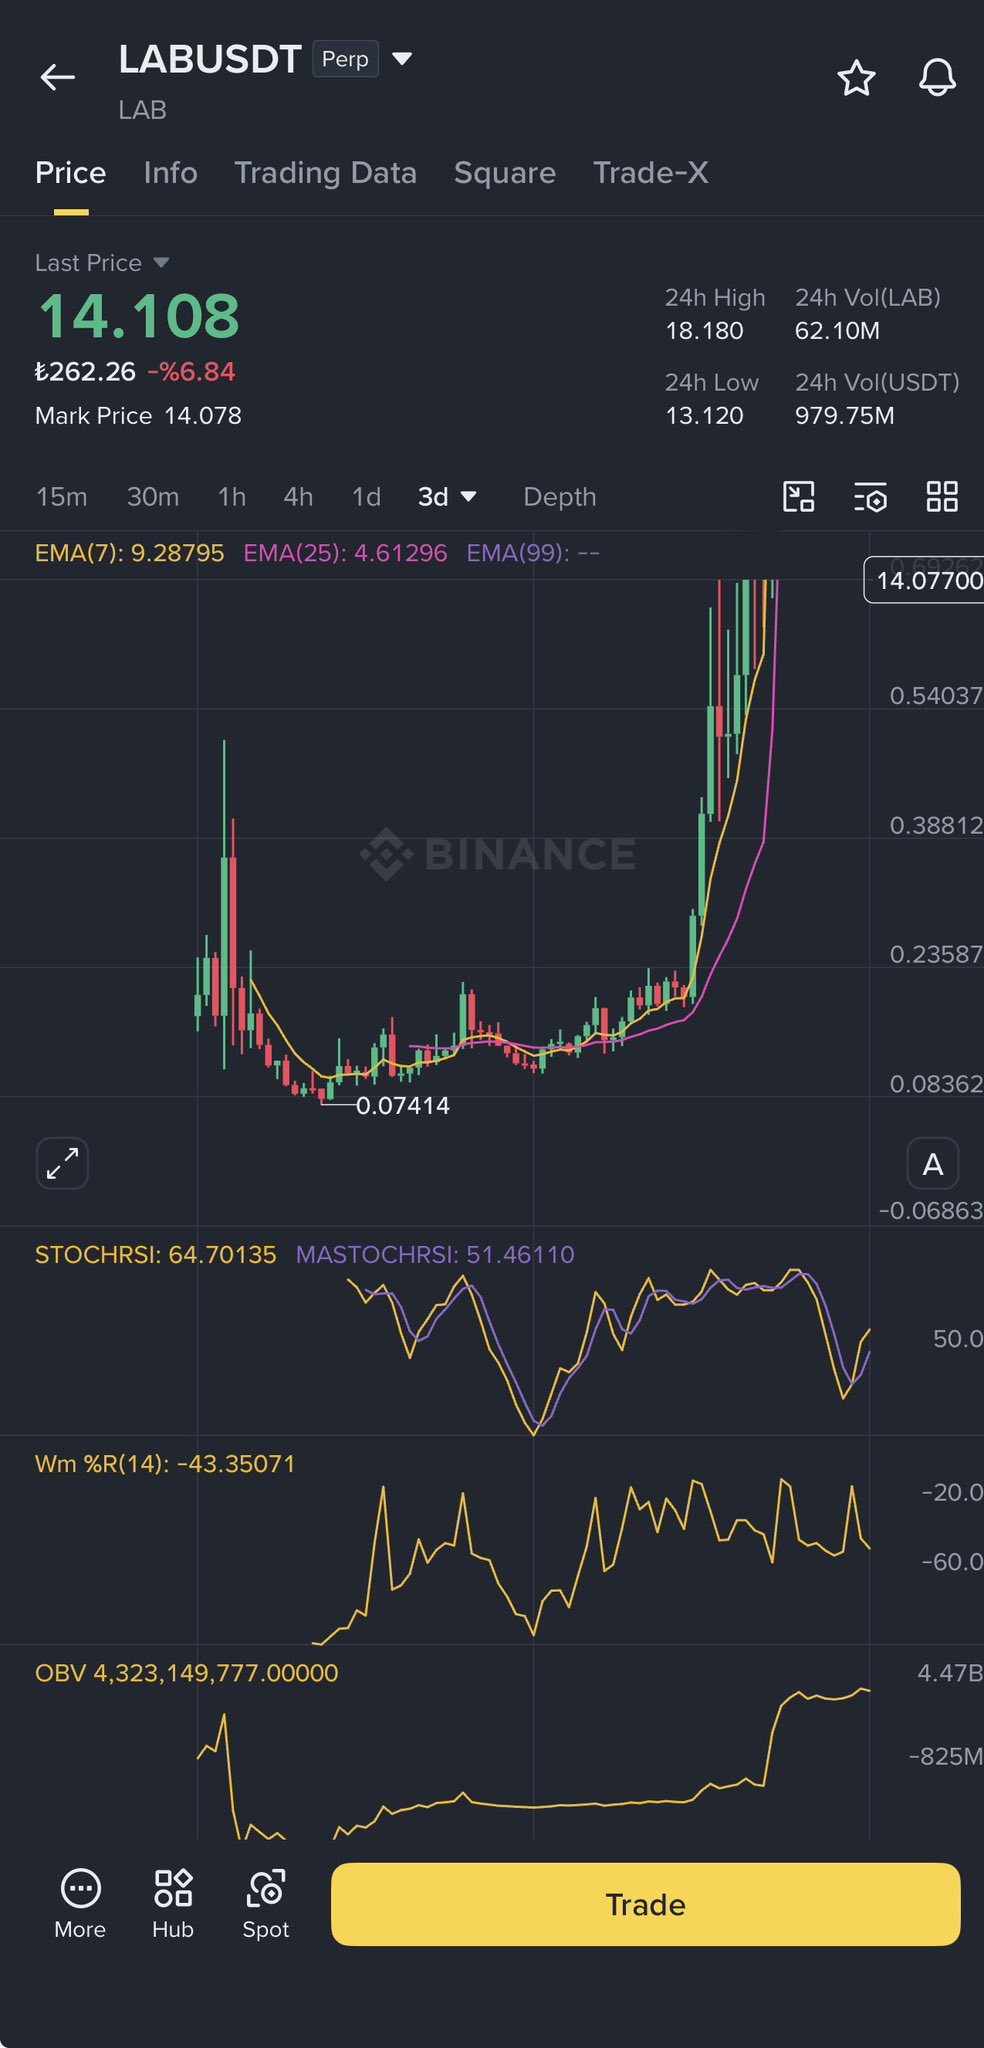
TA pattern resembles LAB before its big rally, indicating long accumulation may lead to a major breakthrough.
Crypto Tolga
TA_Analyst
Trader
B
79.1K @CryptoTolga_ #BİNANCE #Altcoin #BİTCOİN
I see a lot of similarities between these two charts.
One of the main reasons is the market maker footprint.
Based on my research from publicly available sources, there are indications that both projects may have some level of GSR involvement.
From a technical perspective, #TA’s current structure strongly reminds me of #LAB’s price action around the $0.20 region.
The extended accumulation phase, gradually increasing volume, and recovery from the bottom all look remarkably similar.
Of course, there is no guarantee that the exact same scenario will play out.
However, based on the current setup, #TA appears to be one of the closest projects to the structure that #LAB formed before its major move.
#TA #LAB #Crypto #Altcoins
 81
81
 18
18
 13.2K
13.2K
2026-06-07 05:18
Tendência de TA após o lançamento
Extremamente Bullish
TA pattern resembles LAB before its big rally, indicating long accumulation may lead to a major breakthrough.
Crypto Tolga
TA_Analyst
Trader
B
79.1K @CryptoTolga_ Altista
The technical structure of TA resembles that of LAB before its surge, suggesting TA may experience a significant rise.
#BİNANCE #Altcoin #BİTCOİN
I see a lot of similarities between these two charts.
One of the main reasons is the market maker footprint.
Based on my research from publicly available sources, there are indications that both projects may have some level of GSR involvement.
From a technical perspective, #TA’s current structure strongly reminds me of #LAB’s price action around the $0.20 region.
The extended accumulation phase, gradually increasing volume, and recovery from the bottom all look remarkably similar.
Of course, there is no guarantee that the exact same scenario will play out.
However, based on the current setup, #TA appears to be one of the closest projects to the structure that #LAB formed before its major move.
#TA #LAB #Crypto #Altcoins
81
18
13.2K
2026-06-07 05:18
Tendência de TA após o lançamento
Altista
The technical structure of TA resembles that of LAB before its surge, suggesting TA may experience a significant rise.

Cyriptoman4
TA_Analyst
Trader
B
27.8K @Cyriptoman4 Extremamente Bullish
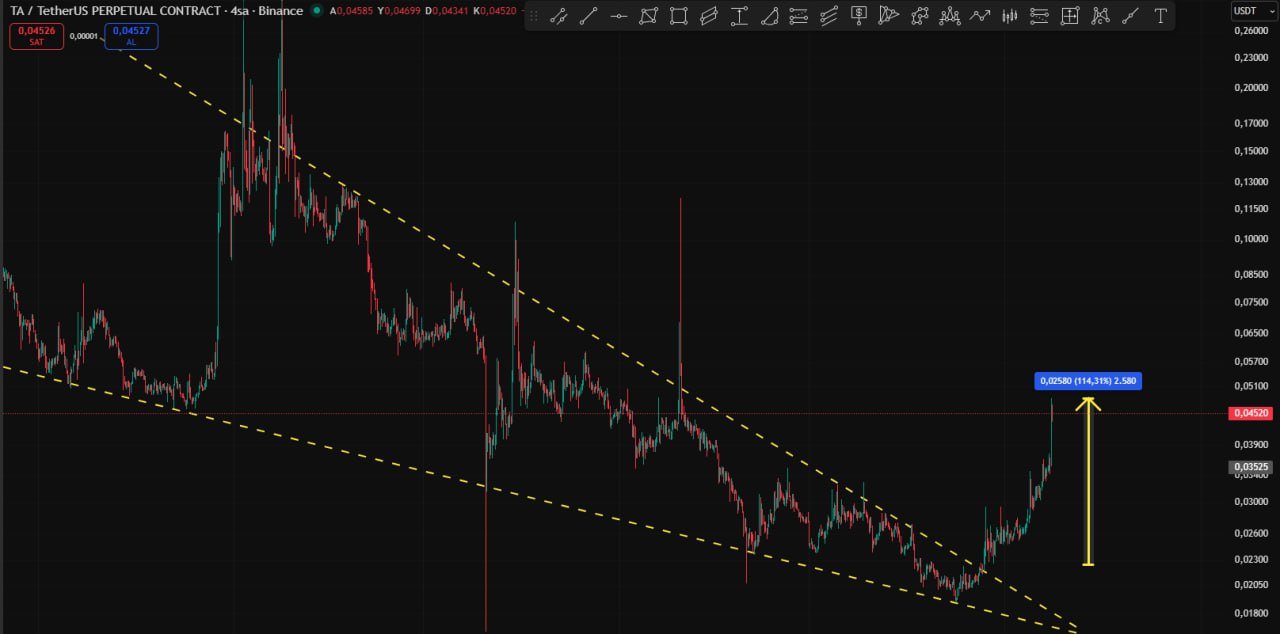
TA has broken through resistance and risen 130%; if it breaks 0.055, the target is 0.10‑0.1250.
#TA Current Analysis ; 📊📊
#TA 0,055 $ resistance zone.
In case of a resistance break, I think the rise will continue up to 0,10 / 0,1250.
🛑This level does not appear suitable for buying.
0,045 could be considered.
SL: 10% https://t.co/B6Ab08UsTR
Cyriptoman4
TA_Analyst
Trader
B
27.8K @Cyriptoman4 #TA analysis successfully reached the target. It made a fast attack with a KAMA break.
✅ Approximately +130% gain. 👏👏 https://t.co/oU6CbZwobo
 53
4
2.3K
53
4
2.3K
2026-03-15 08:27
Tendência de TA após o lançamento
Extremamente Bullish
TA has broken through resistance and risen 130%; if it breaks 0.055, the target is 0.10‑0.1250.
Previsão de preço
Quando é um bom momento para comprar TA? Devo comprar ou vender TA agora?
Ao decidir se é um bom momento para comprar ou vender Trusta.AI (TA), é importante primeiro se alinhar à sua própria estratégia de trading e perfil de risco. Investidores de longo prazo e traders de curto prazo geralmente interpretam as condições de mercado de forma diferente, então sua decisão deve refletir a sua abordagem pessoal. De acordo com a análise técnica de 4 horas mais recente de TA, o sinal de trading atual é Comprar. De acordo com a mais recente análise técnica de 1 dia de TA, o sinal atual é Comprar.

Previsão do Beacon
Previsão Probabilística de Preço (Próximas 24 horas)Aviso de Isenção de Responsabilidade de Previsões do Beacon
Os resultados dos dados exibidos nesta página são analisados com base em dados de negociação reais (OHLCV) do par de trading selecionado, juntamente com indicadores técnicos correspondentes.
Esta previsão é um produto técnico experimental, fornecida apenas para fins de referência. Ela não constitui uma orientação de investimento. Eventos inesperados no mundo real podem afetar significativamente o comportamento do mercado. Os traders devem tomar decisões com cautela.
Esta previsão é um produto técnico experimental, fornecida apenas para fins de referência. Ela não constitui uma orientação de investimento. Eventos inesperados no mundo real podem afetar significativamente o comportamento do mercado. Os traders devem tomar decisões com cautela.
Sobre Trusta.AI
Trusta.AI (TA) is a cryptocurrency launched in 2025and operates on the BNB Smart Chain (BEP20) platform. Trusta.AI has a current supply of 1,000,000,000 with 309,305,546 in circulation. The last known price of Trusta.AI is 0.08036599 USD and is up 1.50 over the last 24 hours. It is currently trading on 116 active market(s) with $12,263,357.61 traded over the last 24 hours. More information can be found at https://www.trustalabs.ai/.
Leia mais
Explore Mais
BM Discovery


Nova Listagem

GCOIN G COIN
-- 0.00%

ISK$ Iskander Coin
-- 0.00%

$BLAST SafeBLAST
-- 0.00%

SPYON SPDR S&P 500 Tokenized ETF (Ondo)
-- 0.00%

QQQON Invesco QQQ Tokenized ETF (Ondo)
-- 0.00%

MCDON McDonald's Tokenized Stock (Ondo)
-- 0.00%

MSTRON MicroStrategy Tokenized Stock (Ondo)
-- 0.00%

AVGOON Broadcom Tokenized Stock (Ondo)
-- 0.00%

CRCLON Circle Internet Group Tokenized Stock (Ondo)
-- 0.00%

COINON Coinbase Tokenized Stock (Ondo)
-- 0.00%
Comprar TA
Comércio TA