Rewards
Futures Daily Draw
100% Chance To Win With Daily Trades
현물 일일 추첨
Win 8,888 USDT In Grand Prizes
휴대폰 요금 충전
온라인으로 간편하고 안전하게 휴대폰 요금을 충전하세요.
Send
Send money globally, fast and secure
BitMart Mall
Live on crypto

The Graph Live Price data
Today's price of The Graph Is $ 0.019 (GRT/USD). With A Market Cap Of $ 212.44M USD. 24-Hour Trading Volume Of $ 688.81K USD, A 24-Hour Price Change Of +0.14%, And A Circulating Supply Of 10.84B GRT.
The Graph GRT Price History USD
Track the price of The Graph for today, 7 days, 30 days and 90 days
기간
변경하기
Change (%)
오늘
$ 0.000078
0.40%
7일
$ 0.0059
-23.43%
30일
$ 0.0062
-24.32%
90일
$ 0.0050
-20.61%
Own GRT Now
Buy and sell GRT easily and securely on BitMart.
The Graph Market Information
$ 0.019 24h Range $ 0.020
All time high
$ 2.88
All time low
$ 0.00098
24시간 변동률
0.14%
24시간 거래량
$ 688,809.29
유통량
10.84B
GRT
Market cap
$ 212.44M
Max supply
--
Fully diluted market cap
$ 226.37M
거래하기 GRT

The Graph X 인사이트

Blockster
미디어
인플루언서
A
 83.2K @BlocksterCom
 상승세
The Graph (GRT)는 기업 블록체인 채택을 촉진할 전망이며, 전망이 밝습니다.

The Graph D
340.6K @graphprotocol The reason enterprise adoption moves slowly is not skepticism about the technology. It is the gap between what blockchain can do and what regulated institutions are allowed to touch.
SOC-2 준수. 검증된 노드 운영자. 감사 가능한 데이터.
"The Graph의 로드맵은 이를 해결하고자 하며, 저는 The Graph가 그 대화의 일부가 될 것이라고 매우 낙관하고 있습니다." - Nick, 팀 리드
 118
118
 11
11
 11.0K
11.0K
2026-06-02 14:31
GRT의 출시 후 추세
상승세
The Graph (GRT)는 기업 블록체인 채택을 촉진할 전망이며, 전망이 밝습니다.

BigRugSznMike
기술 분석가
트레이더
C
25.0K @Michael_EWpro 상승세
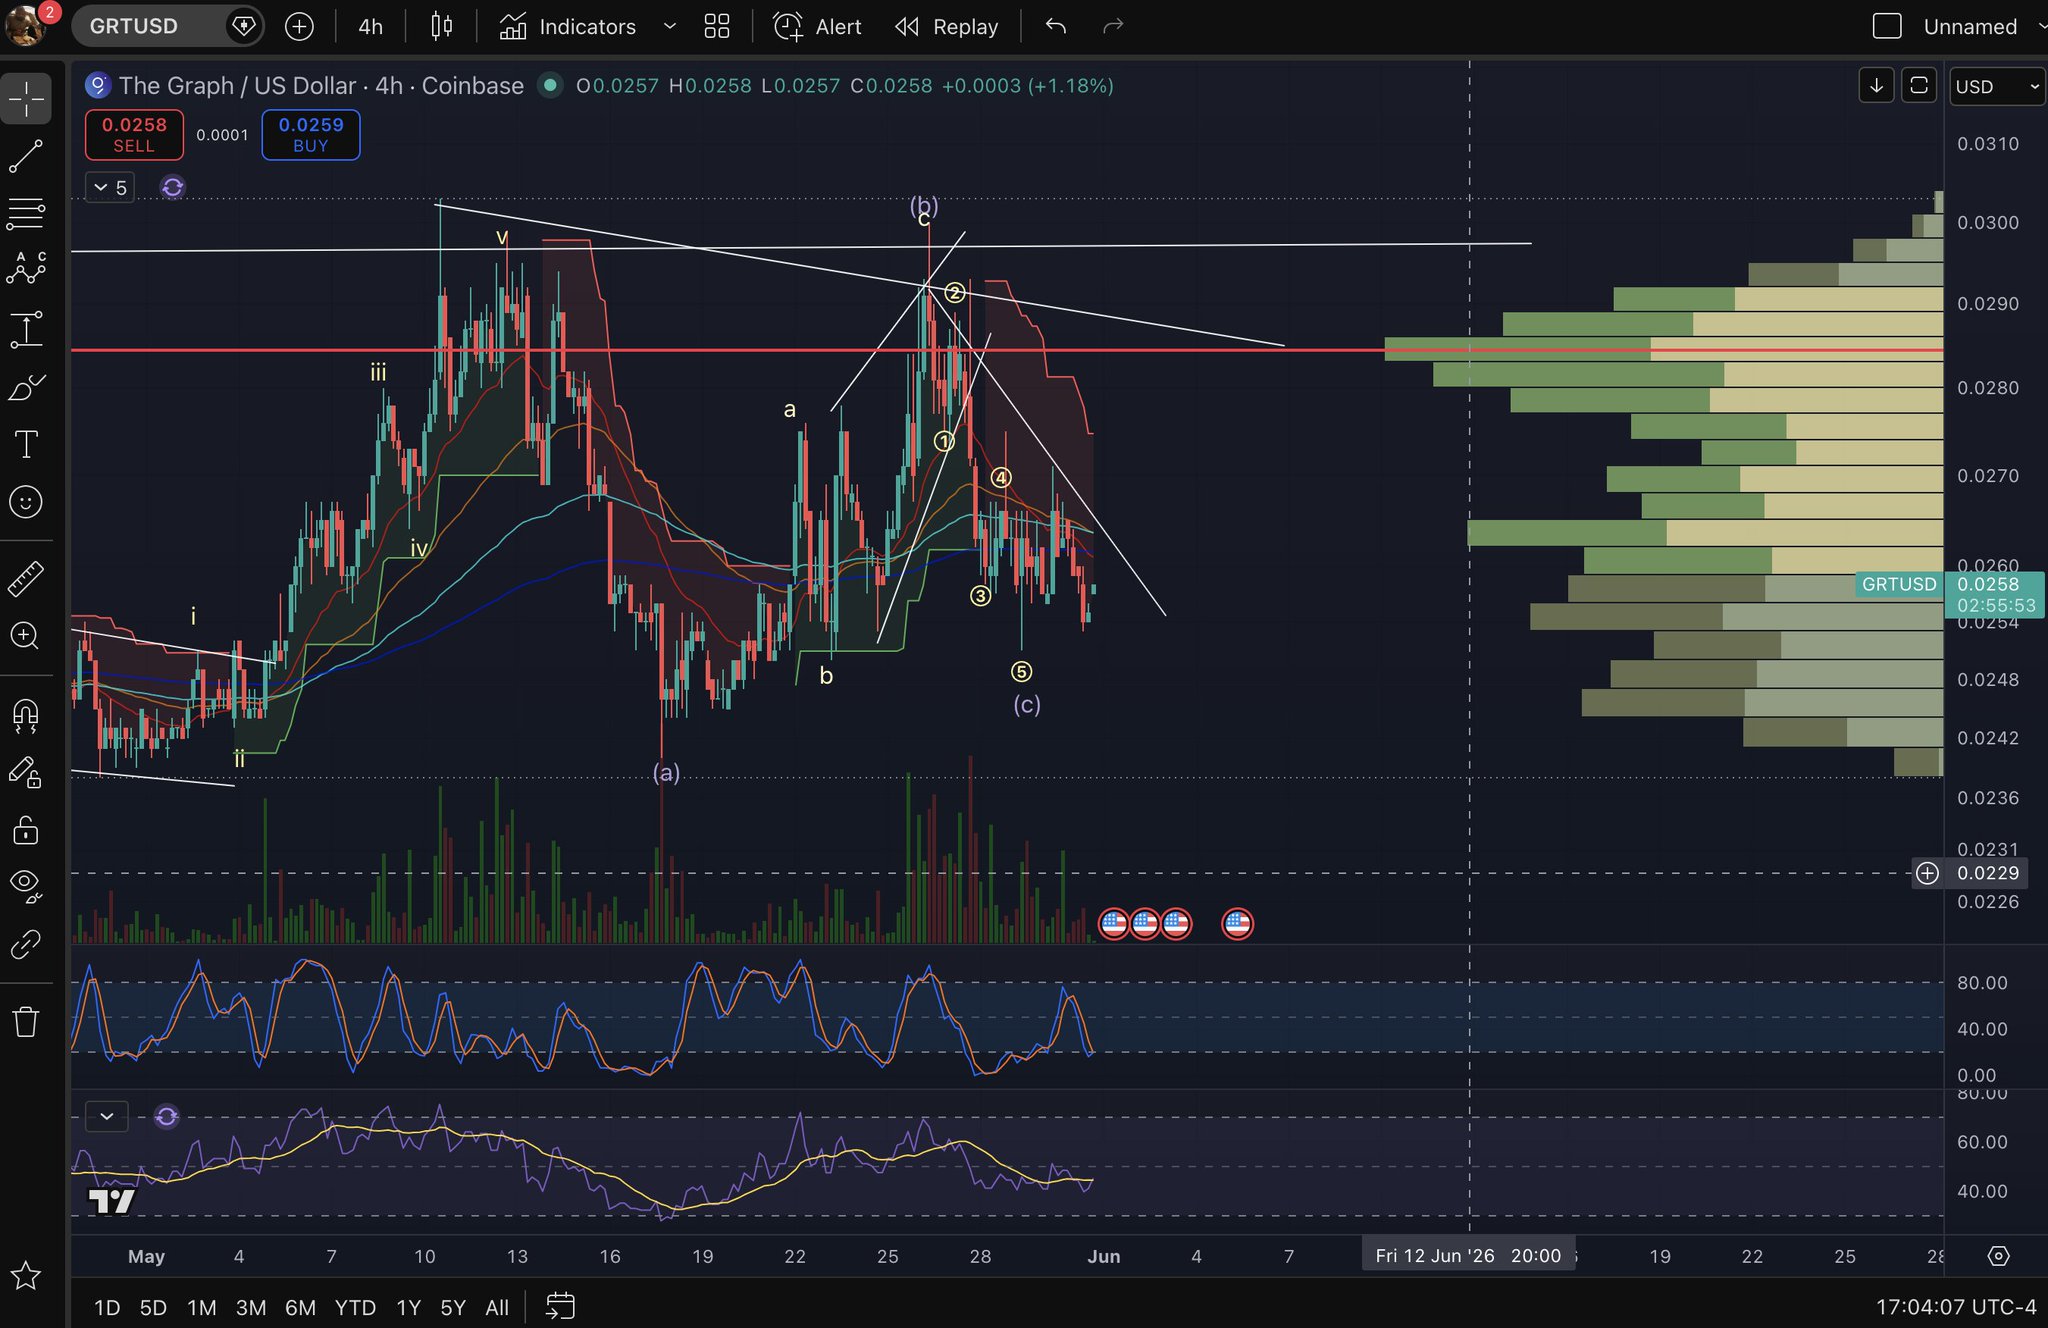
작성자는 GRT가 조정을 마친 후 크게 상승할 것으로 예측하며 목표는 “20 bands”입니다.
이더리움:0xc944e90c64b2c07662a292be6244bdf05cda44a7 위에서 실행 가능하거나 불규칙한 플랫이 나타나는 것으로 보입니다 H4 https://t.co/iHNLGq6wJI
BigRugSznMike
기술 분석가
트레이더
C
25.0K @Michael_EWpro 다음은 이더리움:0xc944e90c64b2c07662a292be6244bdf05cda44a7에 대한 20 bands이며, 비판자들이 나를 계속 흐리게 해도 나는 계속 승리할 것입니다
8
2
2.3K
2026-05-31 21:27
GRT의 출시 후 추세
상승세
작성자는 GRT가 조정을 마친 후 크게 상승할 것으로 예측하며 목표는 “20 bands”입니다.

IncomeSharks
기술 분석가
트레이더
C
744.7K @IncomeSharks 상승세
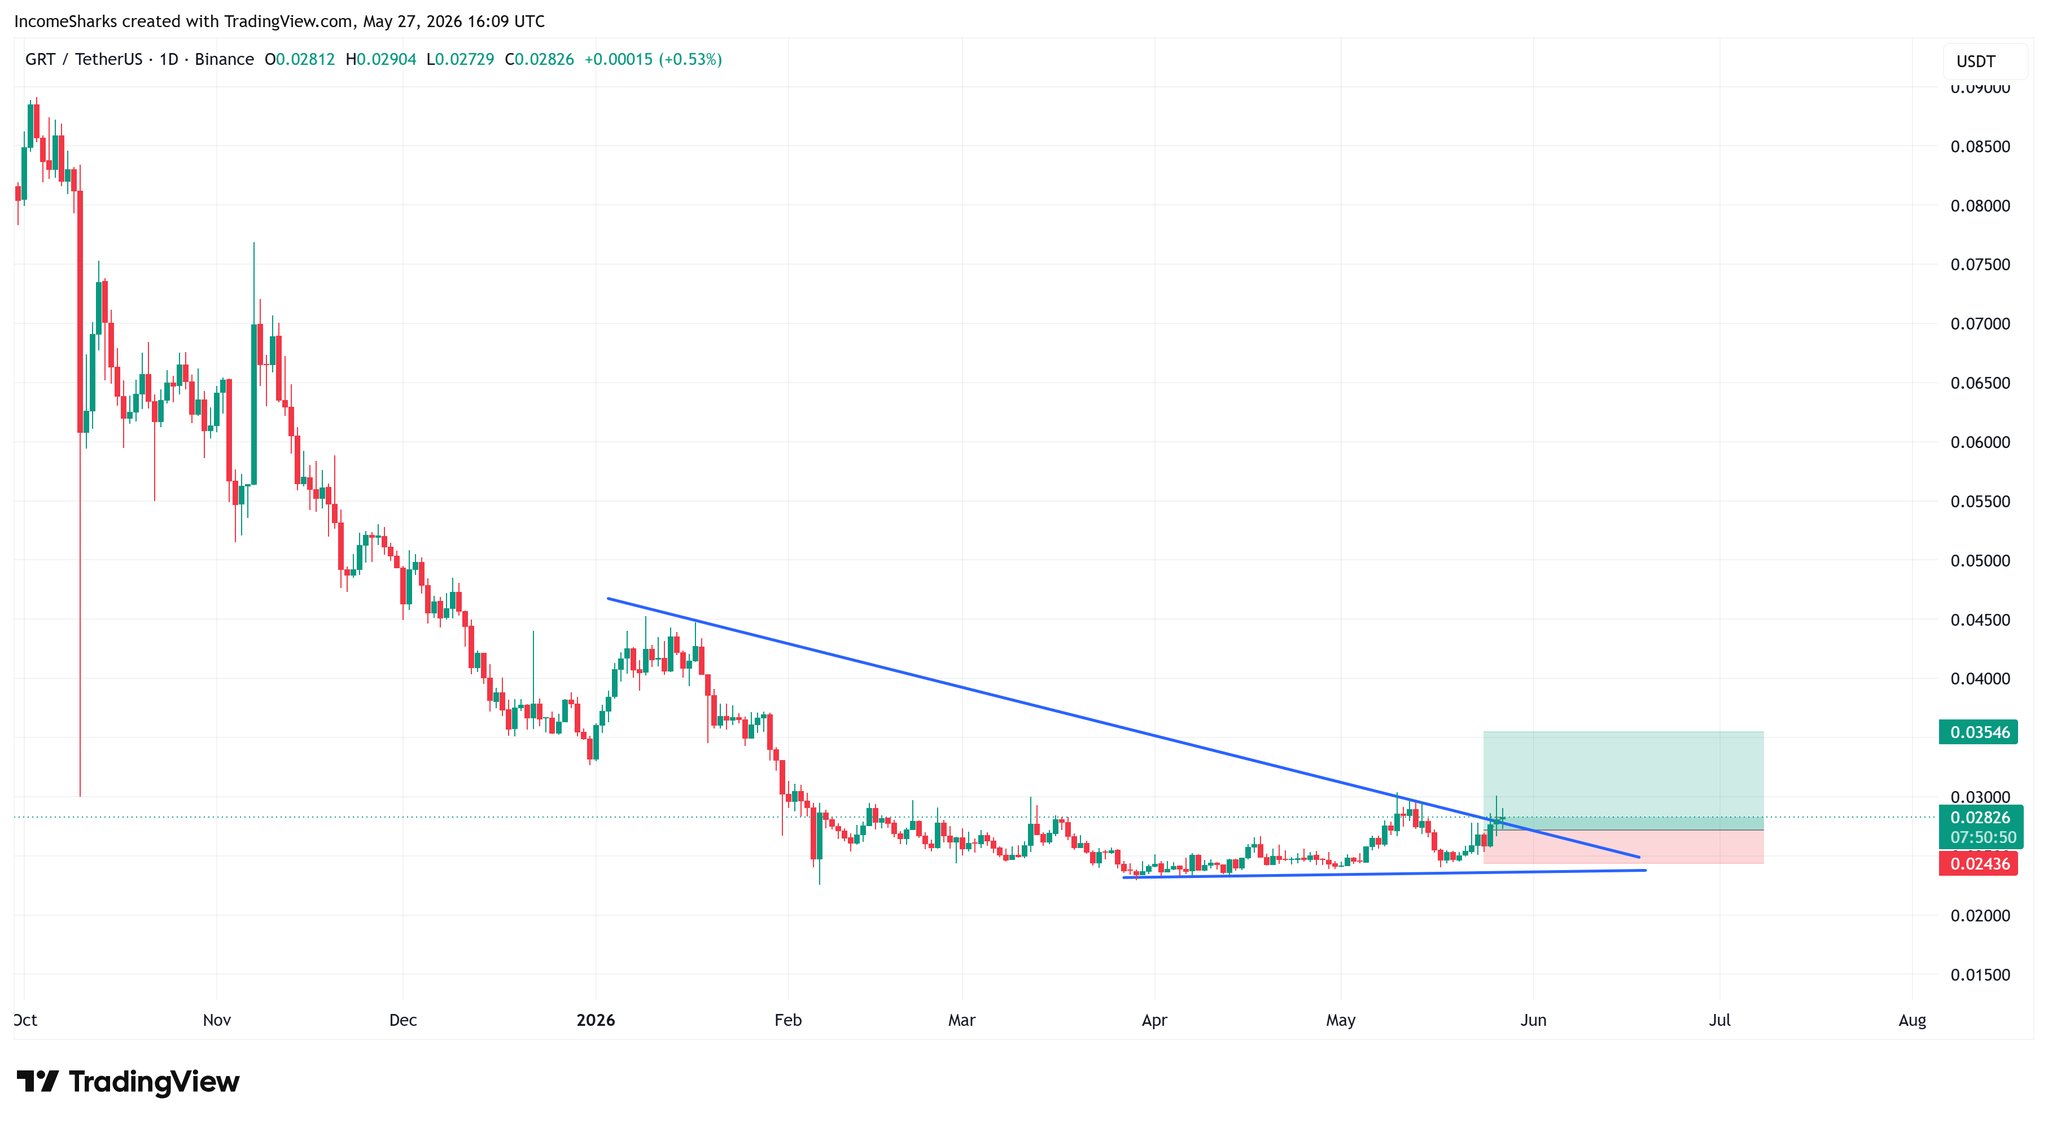
GRT 기술 차트가 명확한 돌파를 보이며, 저자는 기술 분석에 기반한 거래를 권장하고 위험 관리의 중요성을 강조합니다.
$GRT - 이것이 주식이었다면 주저하지 않고 매수했지만, 암호화폐라서 더 망설여집니다. 꽤 깔끔한 돌파이며, 순수히 기술적 분석(TA) 전략으로, 잘 안 될 경우 쉽게 무효화됩니다. https://t.co/OYlG5kWbgk
IncomeSharks
기술 분석가
트레이더
C
744.7K @IncomeSharks Every time I want to dip my toes back into crypto I'm reminded why staying in stocks is better. If this was a Stock it'd be up 30% today. https://t.co/OHJ3ys4TsR
 385
45
57.6K
385
45
57.6K
2026-05-27 16:37
GRT의 출시 후 추세
상승세
GRT 기술 차트가 명확한 돌파를 보이며, 저자는 기술 분석에 기반한 거래를 권장하고 위험 관리의 중요성을 강조합니다.
가격 예측
When is a good time to buy GRT? Should I buy or sell GRT now?
When deciding whether it’s a good time to buy or sell The Graph (GRT), it’s important to first align with your own trading strategy and risk profile.Long-term investors and short-term traders often interpret market conditions differently, so your decision should reflect your personal approach. According to the latest GRT 4-hour technical analysis, the current trading signal is Hold. According to the latest GRT 1-day technical analysis, the current signal is 매수.

Beacon Prediction
Probabilistic Price Forecast (Next 24 Hours)Beacon Prediction Disclaimer
The data results displayed on this page are analyzed based on actual trading data (OHLCV) of the selected trading pair along with corresponding technical indicators.
This prediction is an experimental technical product and is provided for reference purposes only. It does not constitute investment advice. Unexpected real-world events may significantly impact market behavior. Traders should make decisions with caution.
This prediction is an experimental technical product and is provided for reference purposes only. It does not constitute investment advice. Unexpected real-world events may significantly impact market behavior. Traders should make decisions with caution.
소개 The Graph
The Graph (GRT) is a cryptocurrency launched in 2018and operates on the Ethereum platform. The Graph has a current supply of 11,551,760,000.429121 with 10,841,335,000.429329 in circulation. The last known price of The Graph is 0.02581323 USD and is down -1.90 over the last 24 hours. It is currently trading on 619 active market(s) with $19,142,969.84 traded over the last 24 hours. More information can be found at https://thegraph.com.
자세히 읽어보기
Explore More
BM 디스커버리


새 리스팅

ISK$ Iskander Coin
-- 0.00%

$BLAST SafeBLAST
-- 0.00%

SPYON SPDR S&P 500 Tokenized ETF (Ondo)
-- 0.00%

QQQON Invesco QQQ Tokenized ETF (Ondo)
-- 0.00%

MCDON McDonald's Tokenized Stock (Ondo)
-- 0.00%

MSTRON MicroStrategy Tokenized Stock (Ondo)
-- 0.00%

AVGOON Broadcom Tokenized Stock (Ondo)
-- 0.00%

CRCLON Circle Internet Group Tokenized Stock (Ondo)
-- 0.00%

COINON Coinbase Tokenized Stock (Ondo)
-- 0.00%

NFLXON Netflix Tokenized Stock (Ondo)
-- 0.00%
매수 GRT
거래하기 GRT