가입하기
스캔하여 앱 다운로드
iOS 및 안드로이드

Celestia (TIA)

$
$ 0.31 (TIA/USD)
5.26%
24H

Celestia Live Price data

Today's price of Celestia Is $ 0.31 (TIA/USD). With A Market Cap Of $ 286.91M USD. 24-Hour Trading Volume Of $ 1.60M USD, A 24-Hour Price Change Of +5.30%, And A Circulating Supply Of 919.93M TIA.

Celestia TIA Price History USD

Track the price of Celestia for today, 7 days, 30 days and 90 days
기간
변경하기
Change (%)
오늘
$ 0.015
5.26%
7일
$ 0.090
-22.53%
30일
$ 0.074
-19.18%
90일
$ 0.00029
0.10%

Own TIA Now

Buy and sell TIA easily and securely on BitMart.
Buy/Sell TIA Now
Buy/Sell {0} Now
Celestia Market Information
가격 $ 0.31
$ 0.29 24h Range $ 0.31
All time high
‎$ 21.05‎
All time low
‎$ 0.23‎
24시간 변동률
‎5.30%‎
24시간 거래량
‎$ 1,604,028.37‎
유통량
0.92B TIA
Market cap
‎$ 286.91M‎
Max supply
--
Fully diluted market cap
‎$ 364.50M‎
거래하기 TIA

Earn

잔존 암호화폐를 활용하여 저축, 스테이킹 등을 통해 수동 소득을 얻으세요.
지금 사용해 보기
지금 사용해 보기

Celestia X 인사이트

avatar
TIA가 $0.28-0.30의 중요한 지지 구역을 테스트하고 있으며, $0.28 이하로 하락하면 새로운 최저가를 기록할 위험이 있습니다.

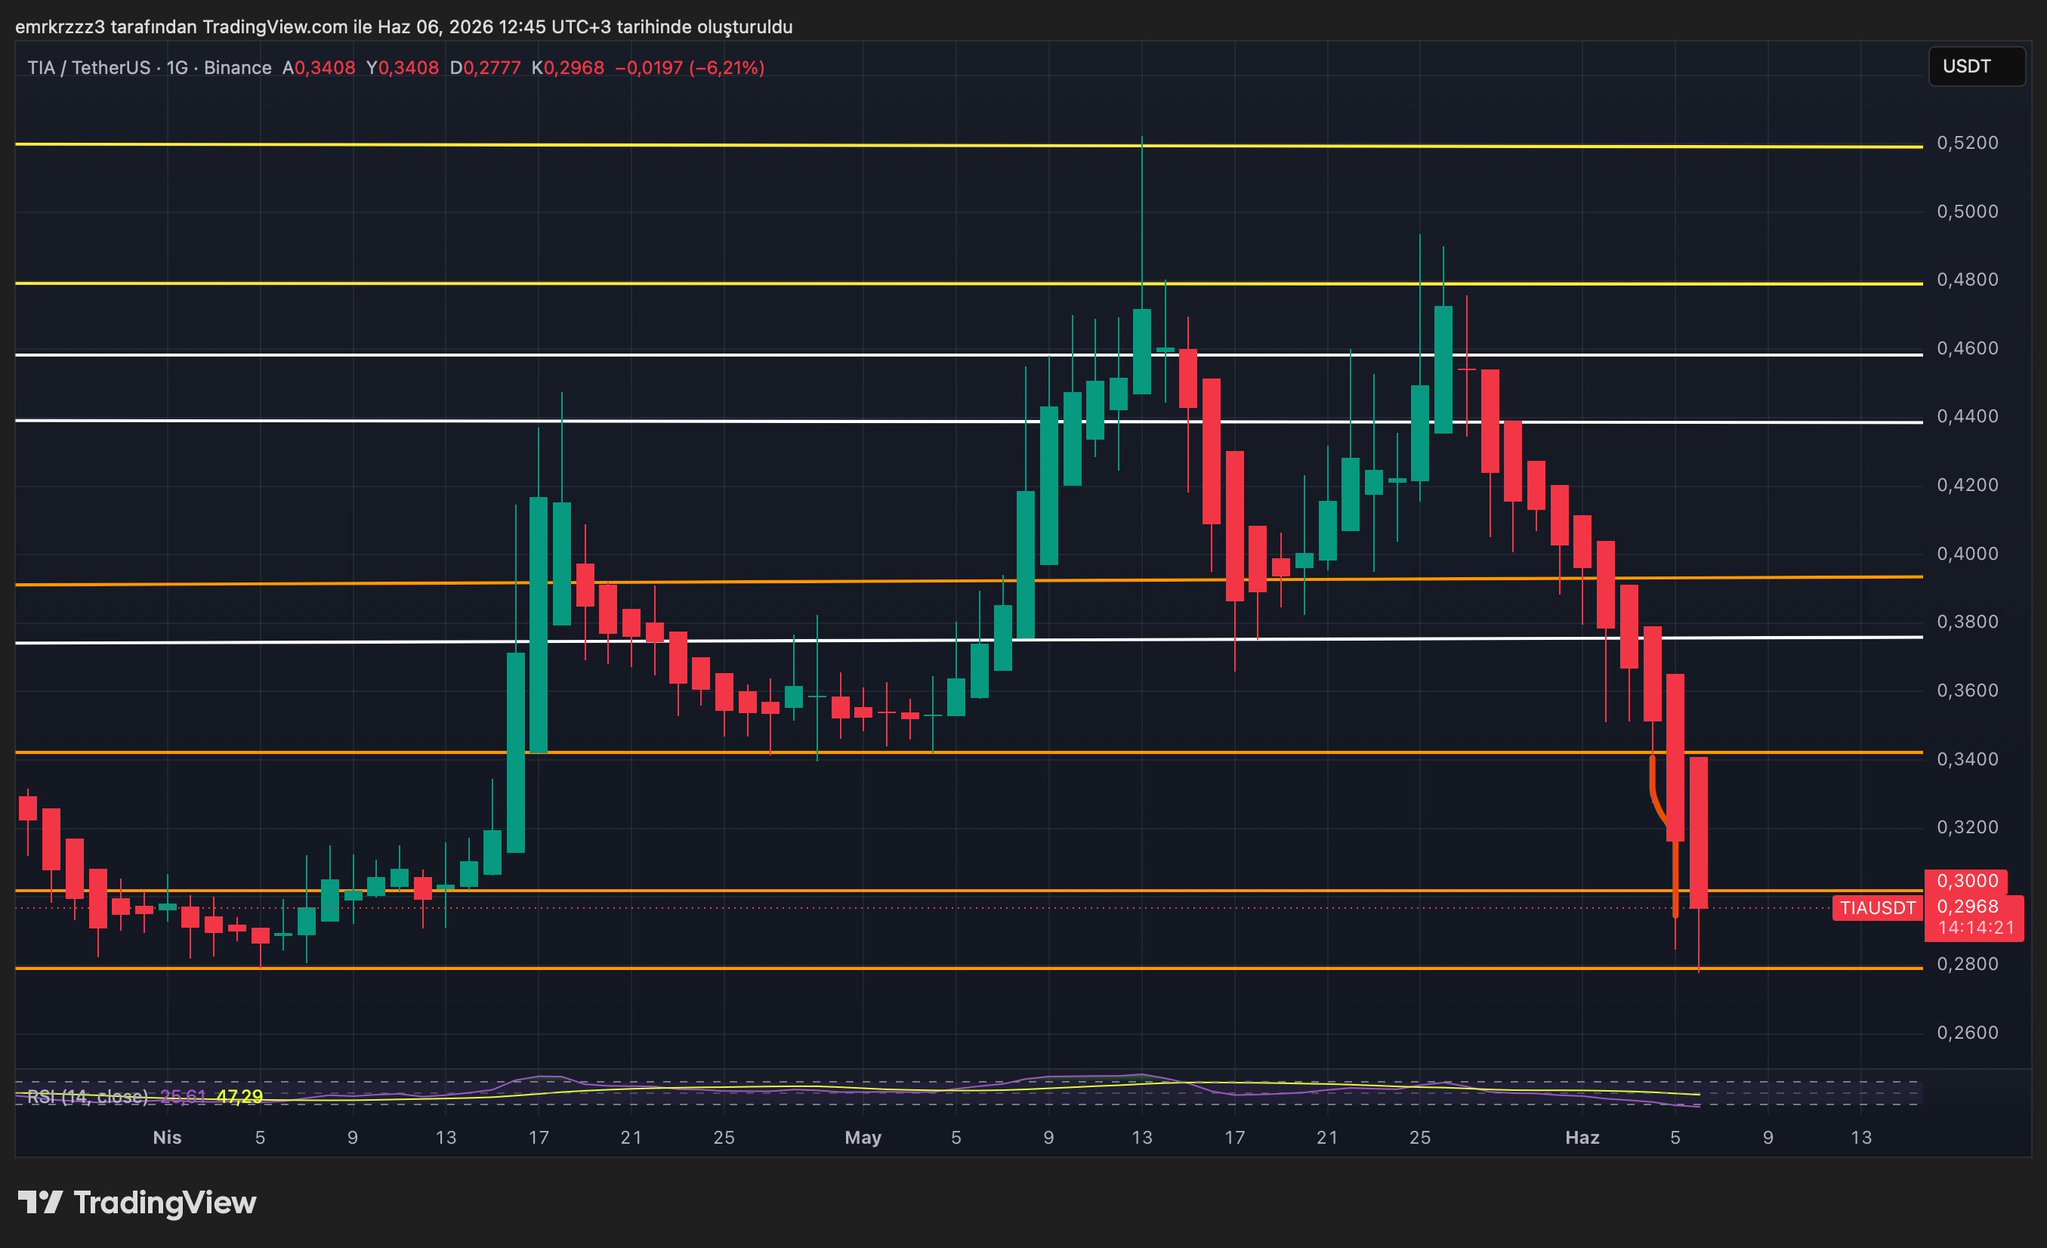
$TIA 0.28-030$ 이 구역에서 반전이 필요합니다. 만약 $0.28 이하로 마감하면 가격이 새로운 저점을 만들 것입니다. $0.28 이상은 주시하고 있습니다.. https://t.co/0yXDCfPaNC

view 35
view 2
view 1.1K
2026-06-06 09:48
TIA의 출시 후 추세
하락세
TIA가 $0.28-0.30의 중요한 지지 구역을 테스트하고 있으며, $0.28 이하로 하락하면 새로운 최저가를 기록할 위험이 있습니다.
avatar
TIA가 98.4% 하락했으며 시가총액은 단 3.5억 달러에 불과해 전망은 약세입니다.

Celestia는 98.4% 하락했으며 여전히 350백만 시가총액을 유지하고 있습니다

우리는 솔직히 그 하락을 받아야 합니다.

view 206
view 14
view 25.7K
2026-06-04 21:27
TIA의 출시 후 추세
하락세
TIA가 98.4% 하락했으며 시가총액은 단 3.5억 달러에 불과해 전망은 약세입니다.
avatar
TIA가 주요 지지선을 깨뜨렸으며, 기술 분석은 더 낮은 가격으로 하락할 가능성을 시사하고, 주간 지지를 주시해야 합니다.

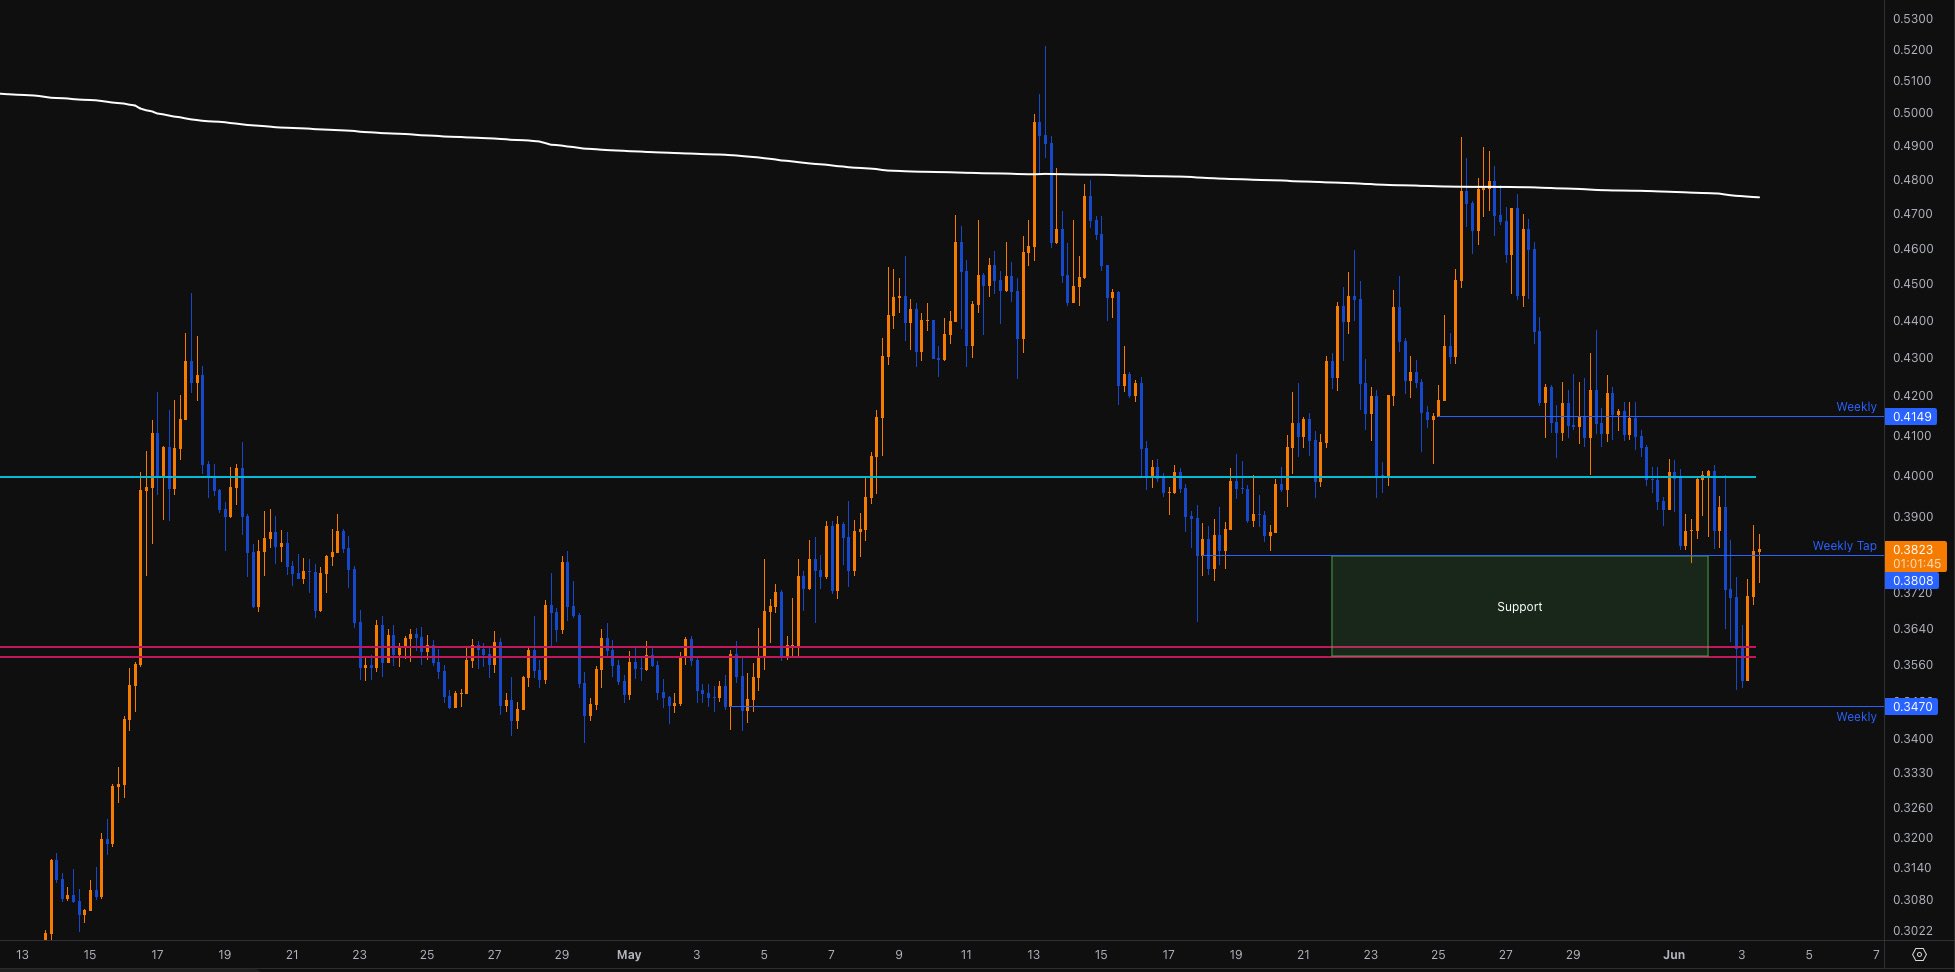
$TIA (4h) 두 개의 POC를 방문했지만, 몇 개의 4h 캔들이 아래에서 마감하며 (잠재적인) 시장 구조 변화를 확인했으며, 이는 더 낮은 가격으로의 문을 엽니다.
$0.415 수준의 주간 차트에도 (매우 국소적인) 거래량 프로파일과 지난 LH의 AVWAP에 대한 POC가 있습니다. 따라서 저항이 될 수 있습니다.
지지선으로는 하위 주간($0.347) 주변과 5월 1일 전후의 저점을 관찰할 수 있습니다 🧐

view 4
view 0
view 414
2026-06-03 16:17
TIA의 출시 후 추세
하락세
TIA가 주요 지지선을 깨뜨렸으며, 기술 분석은 더 낮은 가격으로 하락할 가능성을 시사하고, 주간 지지를 주시해야 합니다.
세부 정보

가격 예측

When is a good time to buy TIA? Should I buy or sell TIA now?

When deciding whether it’s a good time to buy or sell Celestia (TIA), it’s important to first align with your own trading strategy and risk profile.Long-term investors and short-term traders often interpret market conditions differently, so your decision should reflect your personal approach. According to the latest TIA 4-hour technical analysis, the current trading signal is Hold. According to the latest TIA 1-day technical analysis, the current signal is 매수.
49
Hold
4-hour technical analysis of TIA
Last Update 2026-06-07 03:59:59
63
매수
1-day technical analysis of TIA
Last Update 2026-06-08 00:00:00
beacon

Beacon Prediction

Probabilistic Price Forecast (Next 24 Hours)
i
Beacon Prediction Disclaimer
The data results displayed on this page are analyzed based on actual trading data (OHLCV) of the selected trading pair along with corresponding technical indicators.
This prediction is an experimental technical product and is provided for reference purposes only. It does not constitute investment advice. Unexpected real-world events may significantly impact market behavior. Traders should make decisions with caution.
소개 Celestia
Celestia (TIA) is a cryptocurrency launched in 2023and operates on the Osmosis platform. Celestia has a current supply of 1,168,685,161.483695 with 919,932,996.62251 in circulation. The last known price of Celestia is 0.39383101 USD and is down -3.57 over the last 24 hours. It is currently trading on 354 active market(s) with $27,084,698.86 traded over the last 24 hours. More information can be found at https://www.celestia.org.
자세히 읽어보기
매수 TIA
거래하기 TIA