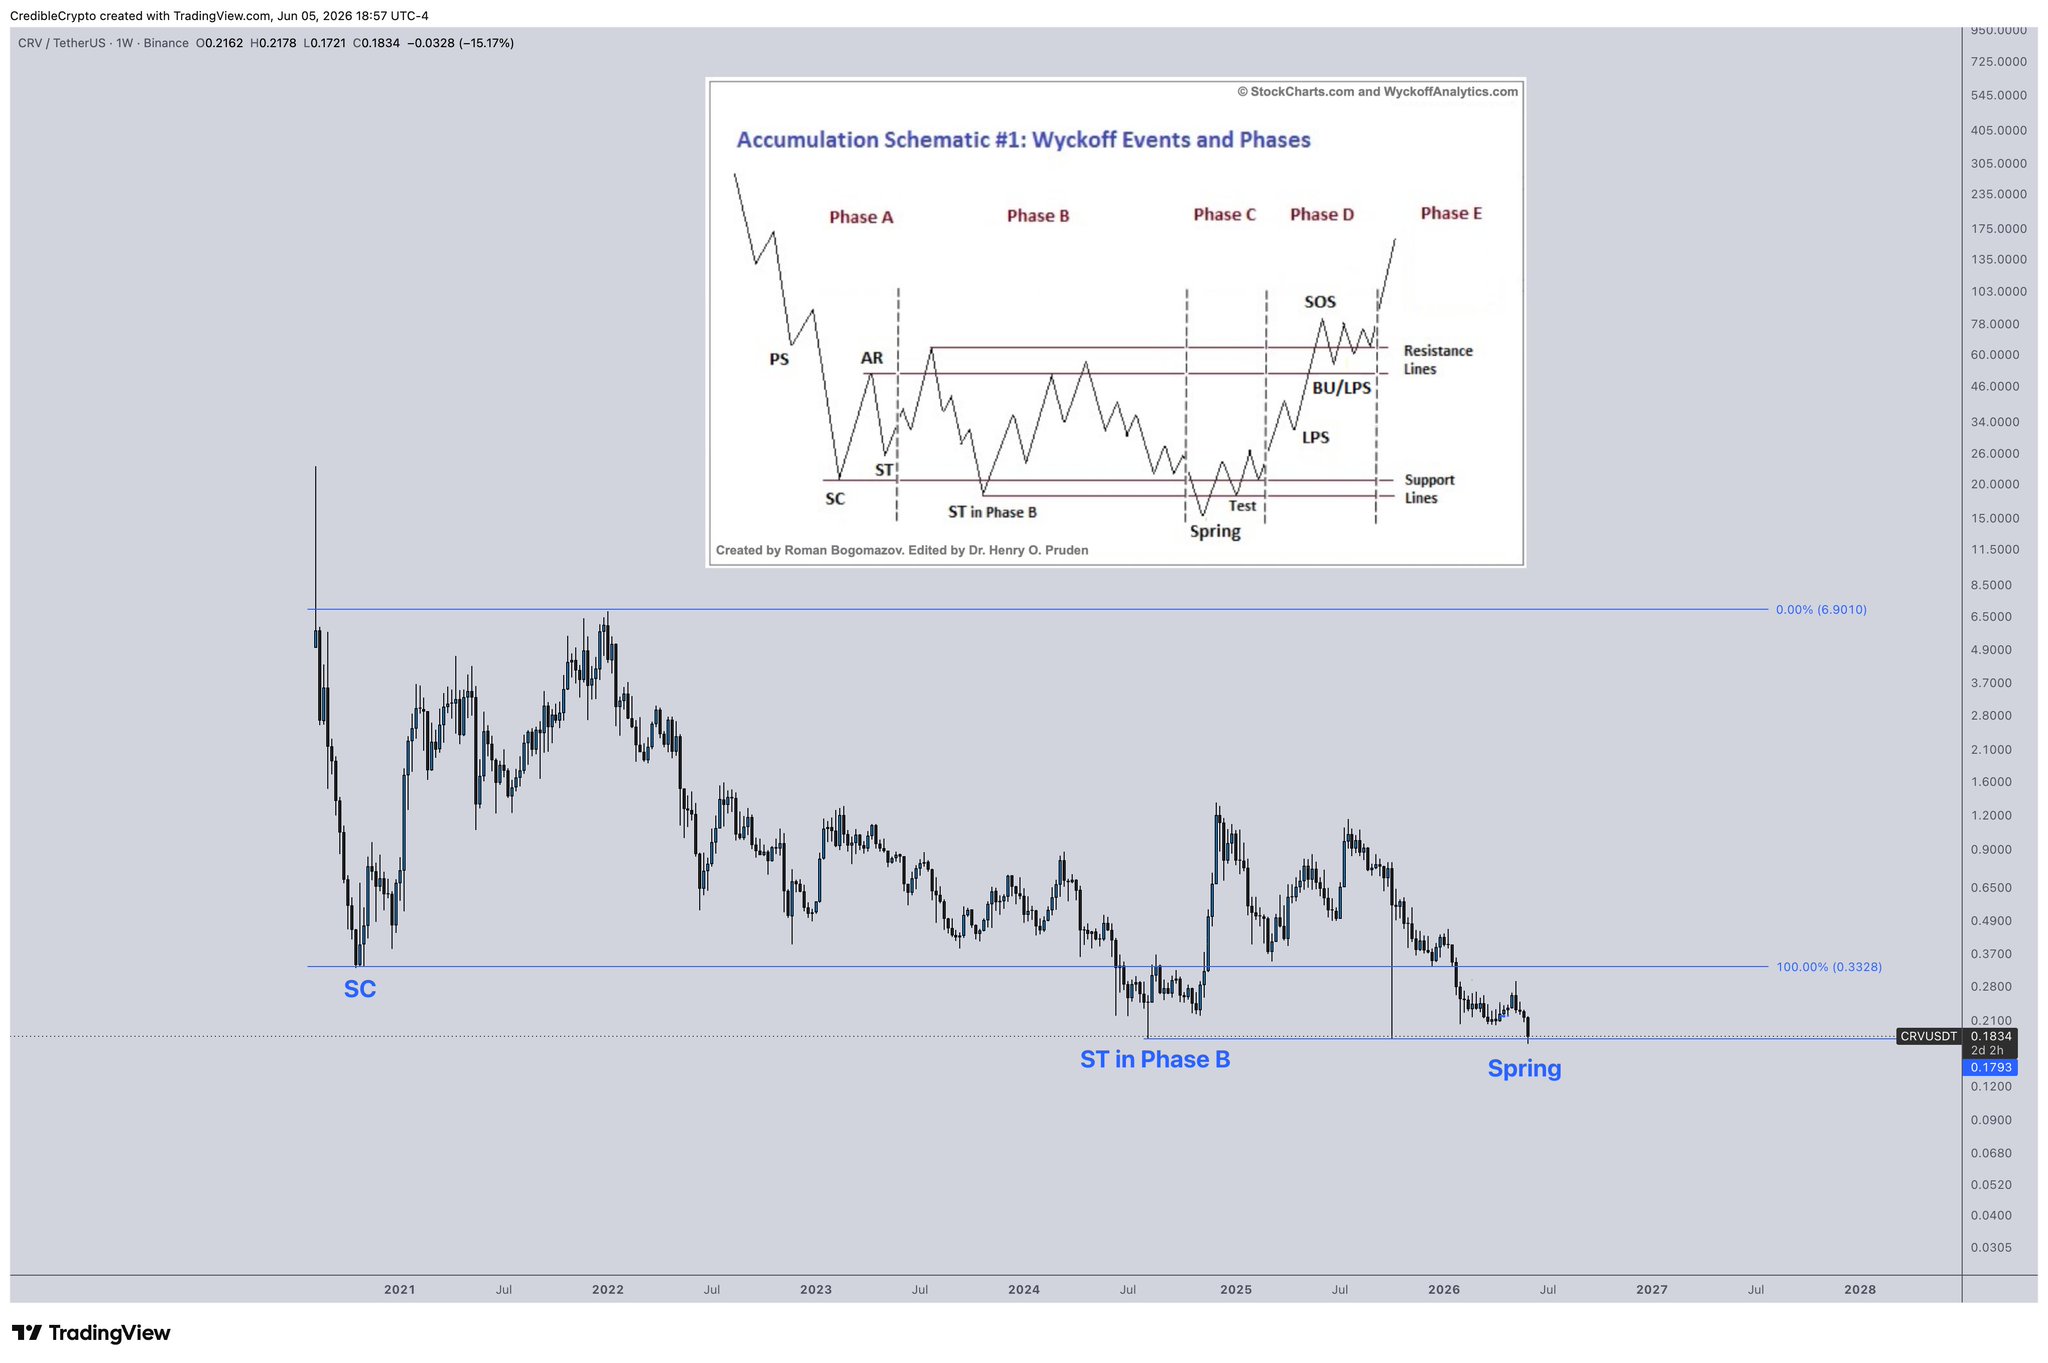
Added some more notes to the $CRV chart for reference.
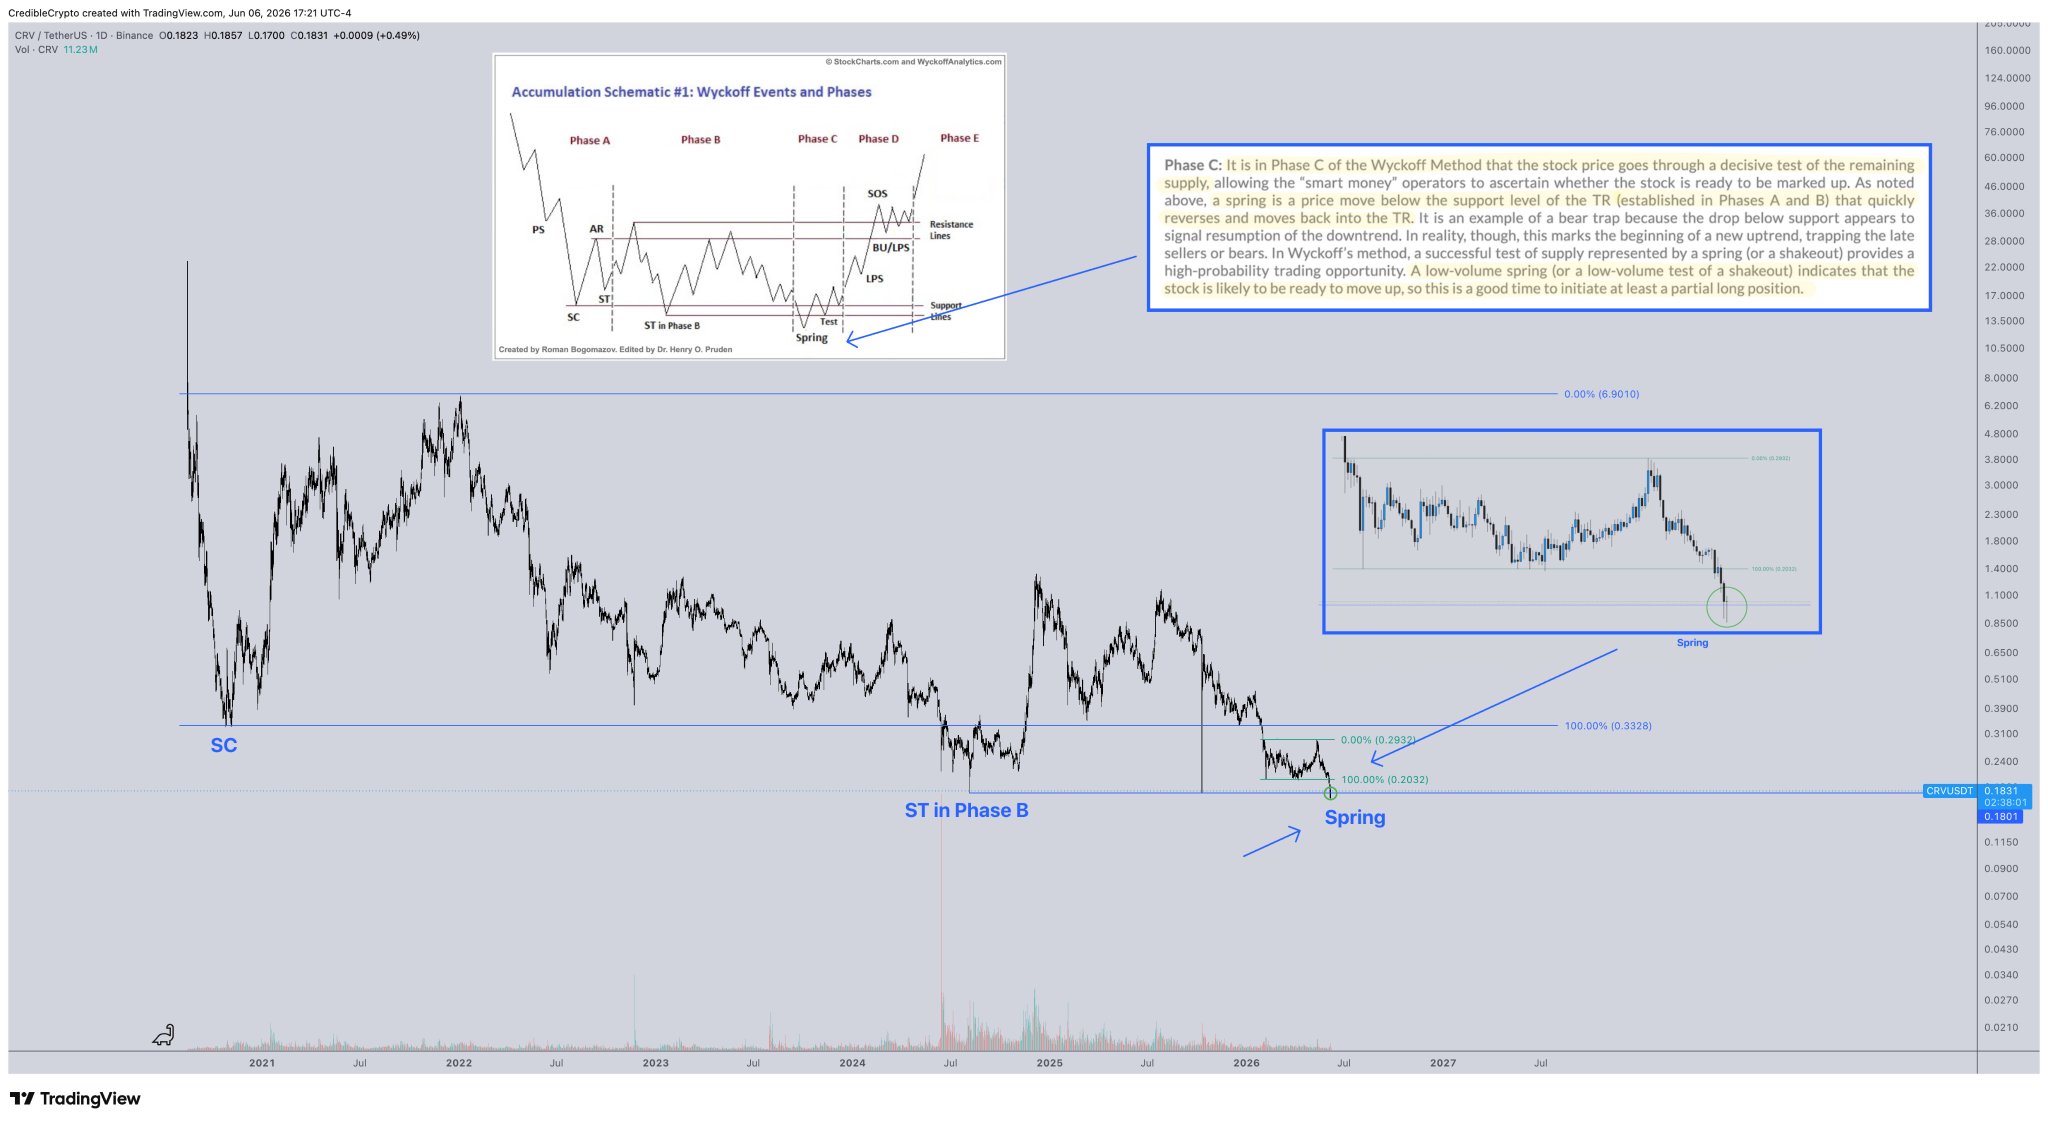
We got a nice daily SFP on our move below our swing that marked the bottom of our TR (trading range).
You'll also note that the spring occurred on relatively low volume. This is key because it indicates that there is no more "excess supply" left on this asset. A break of a major swing low like this would typically coincide with a spike in volume from panic sellers who are selling the "break" or capitulating (like we saw during the 2024 break where we saw record volume from liquidations and forced sellers). The lack thereof validates that excess supply has already been removed at this point AKA weak hands have been completely rinsed and so we are now finally ready for the markup/expansion phase.
While there are significant implications in all of this, one of the biggest is that the 7x rally from .18 to $1.30+ in 2024 wasn't actually the start of the expansion phase but rather just part of the accumulation/basing process, and the "excess supply" that existed at that time was significantly more than what is left today. In other words, on this next move up (the start of the actual expansion phase), supply is even more constricted than it was then, and if this really is the beginning of the expansion phase, for the first time since putting in the initial trading range low back in 2020, then the next leg up should be even stronger/more aggressive than what we saw in 2024 on the rally from .18 to $1.30+.
Now we just need to look for early indications that our rally is beginning (aka low timeframe impulse).