Rewards
Futures Daily Draw
100% Chance To Win With Daily Trades
Spot Daily Draw
Win 8,888 USDT In Grand Prizes
Mobile Top-Up
Top up mobiles easily, online, secure
Send
Send money globally, fast and secure
BitMart Mall
Live on crypto

The Graph Live Price data
Today's price of The Graph Is $ 0.019 (GRT/USD). With A Market Cap Of $ 214.42M USD. 24-Hour Trading Volume Of $ 689.30K USD, A 24-Hour Price Change Of +0.88%, And A Circulating Supply Of 10.84B GRT.
The Graph GRT Price History USD
Track the price of The Graph for today, 7 days, 30 days and 90 days
Period
Change
Change (%)
Today
$ 0.00016
0.87%
7days
$ 0.0061
-23.75%
30days
$ 0.0065
-24.97%
90days
$ 0.0049
-19.94%
Own GRT Now
Buy and sell GRT easily and securely on BitMart.
The Graph Market Information
$ 0.019 24h Range $ 0.020
All time high
$ 2.88
All time low
$ 0.00098
24h Change
0.88%
24h Vol
$ 689,296.72
Circulating supply
10.84B
GRT
Market cap
$ 214.42M
Max supply
--
Fully diluted market cap
$ 228.47M
Trade GRT

The Graph X Insight

Blockster
Media
Influencer
A
 83.2K @BlocksterCom
 Bullish
The Graph (GRT) is expected to drive enterprise blockchain adoption, with a promising outlook.

The Graph D
340.6K @graphprotocol The reason enterprise adoption moves slowly is not skepticism about the technology. It is the gap between what blockchain can do and what regulated institutions are allowed to touch.
SOC-2 compliance. Verified node operators. Auditable data.
"The Graph's roadmap seeks to address that, and I'm super optimistic that The Graph will be part of that conversation." - Nick, Team Lead
 118
118
 11
11
 11.0K
11.0K
2026-06-02 14:31
Trend of GRT after release
Bullish
The Graph (GRT) is expected to drive enterprise blockchain adoption, with a promising outlook.

BigRugSznMike
TA_Analyst
Trader
C
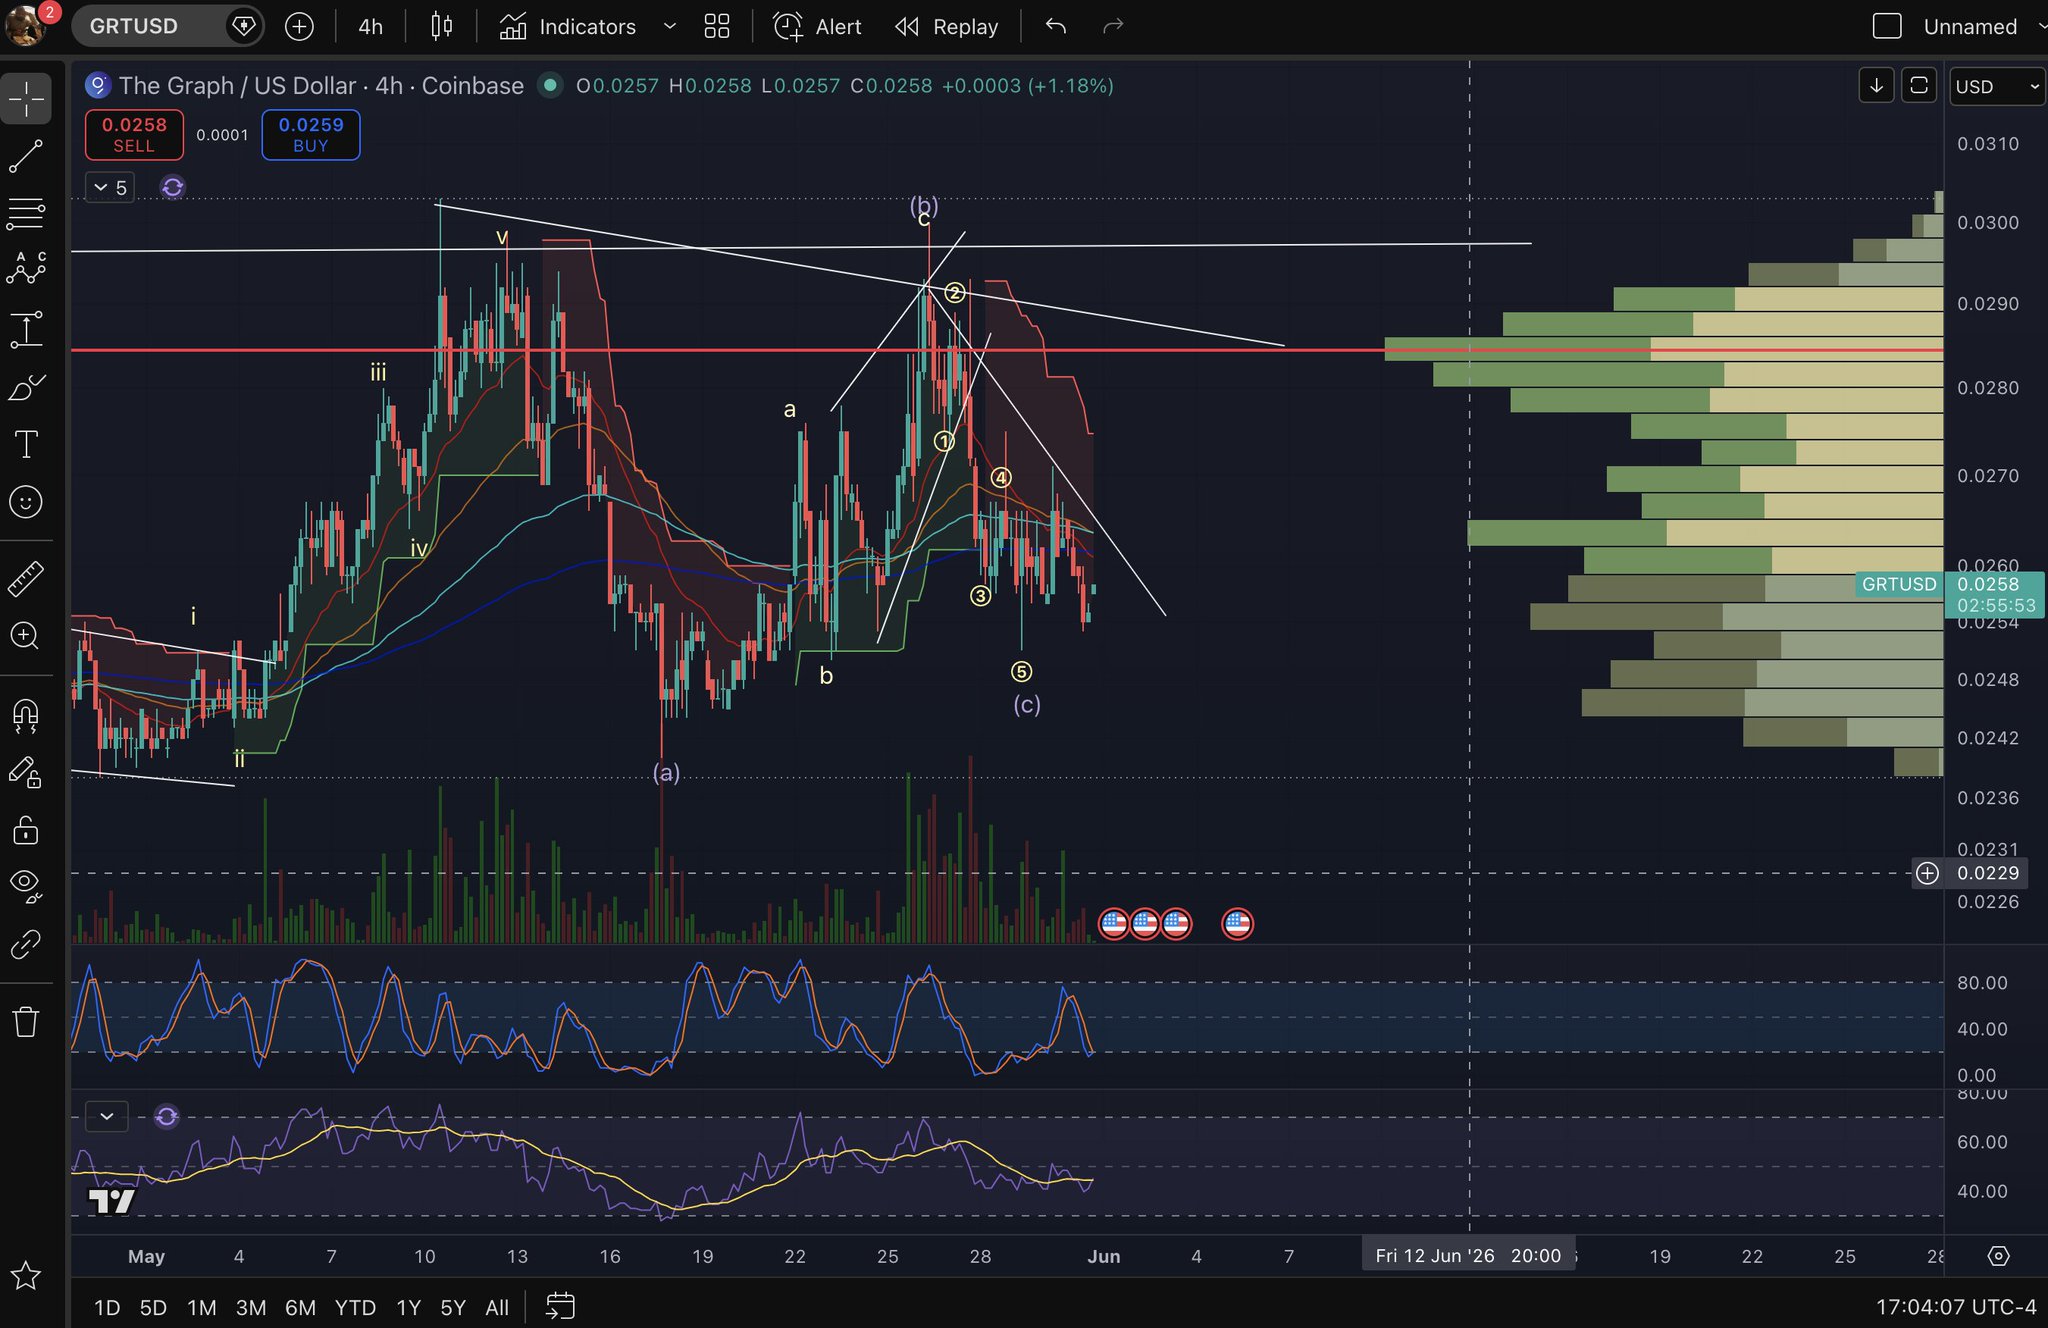
25.0K @Michael_EWpro Bullish
The author predicts GRT will complete a correction and then see a significant rise, target "20 bands".
looks like a possible running or irregular flat on ethereum:0xc944e90c64b2c07662a292be6244bdf05cda44a7 H4 https://t.co/iHNLGq6wJI
BigRugSznMike
TA_Analyst
Trader
C
25.0K @Michael_EWpro Next up 20 bands into ethereum:0xc944e90c64b2c07662a292be6244bdf05cda44a7 let the haters keep fading me and ima keep winning
8
2
2.3K
2026-05-31 21:27
Trend of GRT after release
Bullish
The author predicts GRT will complete a correction and then see a significant rise, target "20 bands".

IncomeSharks
TA_Analyst
Trader
C
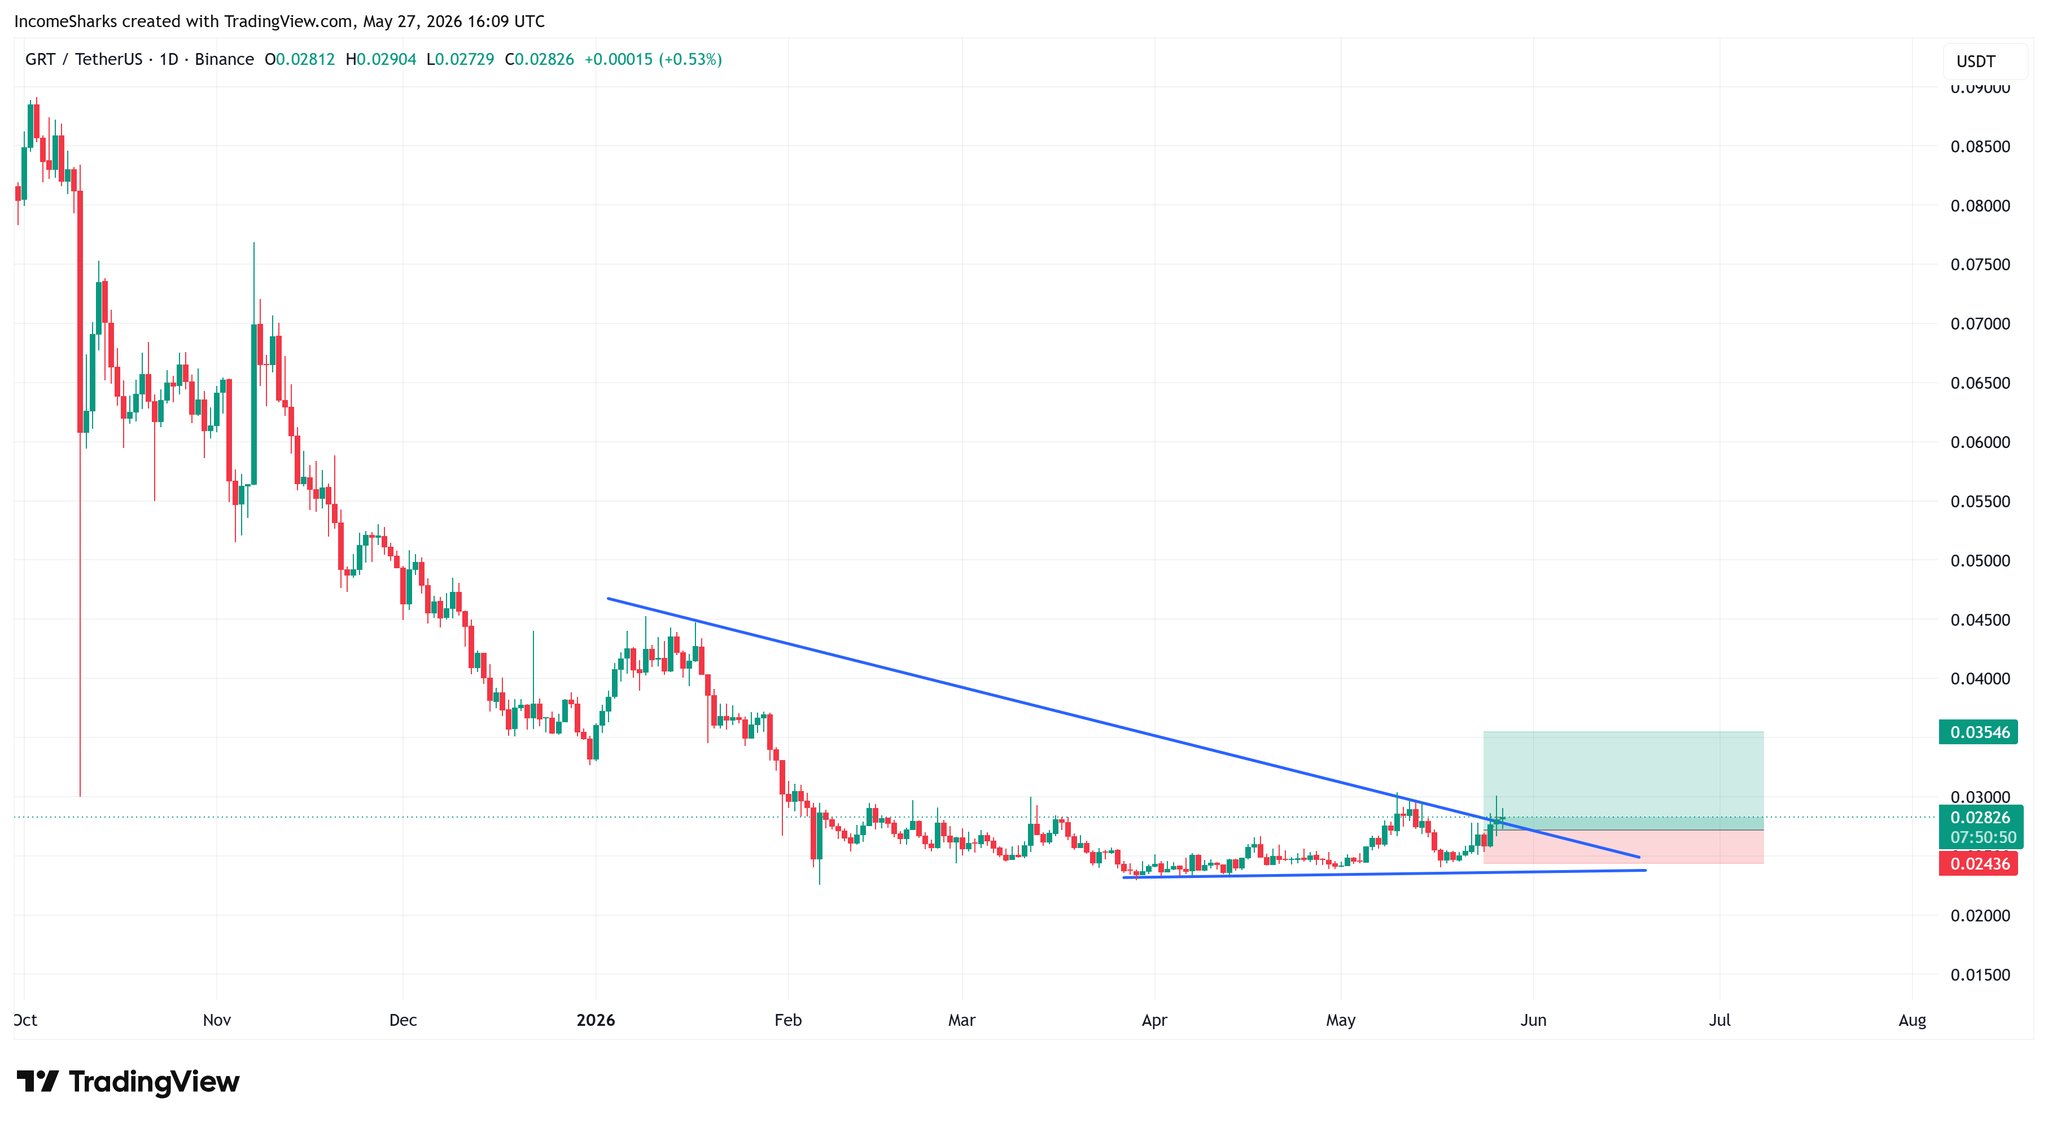
744.7K @IncomeSharks Bullish
The GRT technical chart shows a clear breakout; the author recommends trading based on technical analysis and emphasizes risk management.
$GRT - If this was a stock I wouldn't hesitate to bid but because it's crypto it feels more hesitant. Pretty clean break out, purely TA play with easy invalidation if it doesn't work out. https://t.co/OYlG5kWbgk
IncomeSharks
TA_Analyst
Trader
C
744.7K @IncomeSharks Every time I want to dip my toes back into crypto I'm reminded why staying in stocks is better. If this was a Stock it'd be up 30% today. https://t.co/OHJ3ys4TsR
 385
45
57.6K
385
45
57.6K
2026-05-27 16:37
Trend of GRT after release
Bullish
The GRT technical chart shows a clear breakout; the author recommends trading based on technical analysis and emphasizes risk management.
Price Prediction
When is a good time to buy GRT? Should I buy or sell GRT now?
When deciding whether it’s a good time to buy or sell The Graph (GRT), it’s important to first align with your own trading strategy and risk profile.Long-term investors and short-term traders often interpret market conditions differently, so your decision should reflect your personal approach. According to the latest GRT 4-hour technical analysis, the current trading signal is Hold. According to the latest GRT 1-day technical analysis, the current signal is Buy.

Beacon Prediction
Probabilistic Price Forecast (Next 24 Hours)Beacon Prediction Disclaimer
The data results displayed on this page are analyzed based on actual trading data (OHLCV) of the selected trading pair along with corresponding technical indicators.
This prediction is an experimental technical product and is provided for reference purposes only. It does not constitute investment advice. Unexpected real-world events may significantly impact market behavior. Traders should make decisions with caution.
This prediction is an experimental technical product and is provided for reference purposes only. It does not constitute investment advice. Unexpected real-world events may significantly impact market behavior. Traders should make decisions with caution.
About The Graph
The Graph (GRT) is a cryptocurrency launched in 2018and operates on the Ethereum platform. The Graph has a current supply of 11,551,760,000.429121 with 10,841,335,000.429329 in circulation. The last known price of The Graph is 0.02581323 USD and is down -1.90 over the last 24 hours. It is currently trading on 619 active market(s) with $19,142,969.84 traded over the last 24 hours. More information can be found at https://thegraph.com.
Read More
Explore More
BM Discovery


New Listing

ISK$ Iskander Coin
-- 0.00%

$BLAST SafeBLAST
-- 0.00%

SPYON SPDR S&P 500 Tokenized ETF (Ondo)
-- 0.00%

QQQON Invesco QQQ Tokenized ETF (Ondo)
-- 0.00%

MCDON McDonald's Tokenized Stock (Ondo)
-- 0.00%

MSTRON MicroStrategy Tokenized Stock (Ondo)
-- 0.00%

AVGOON Broadcom Tokenized Stock (Ondo)
-- 0.00%

CRCLON Circle Internet Group Tokenized Stock (Ondo)
-- 0.00%

COINON Coinbase Tokenized Stock (Ondo)
-- 0.00%

NFLXON Netflix Tokenized Stock (Ondo)
-- 0.00%
Buy GRT
Trade GRT