Fetch.ai (FET)
$0.2056 +4.26% 24H
- 70مؤشر المعنويات الاجتماعية (SSI)+174.41% (24h)
- #75ترتيب اتجاه السوق (MPR)+37
- 9الانتشار الاجتماعي 24 سا+125.00% (24h)
- 89%نسبة KOL الصاعدة خلال 24 ساعة8 مؤثر KOL نشط
- ملخص
- إشارات صعود
- إشارات هبوط
مؤشر المعنويات الاجتماعية (SSI)
- البيانات الإجمالية70SSI
- اتجاه SSI (7ي)السعر (7 أيام)توزيع المشاعرمتصاعد بقوة (67%)صاعد (22%)هابط (11%)رؤى SSI
ترتيب اتجاه السوق (MPR)
- منبه الرؤى
منشورات X
 Maelius TA_Analyst Trader A9.60K @MaeliusCryptoMaelius TA_Analyst Trader A9.60K @MaeliusCrypto
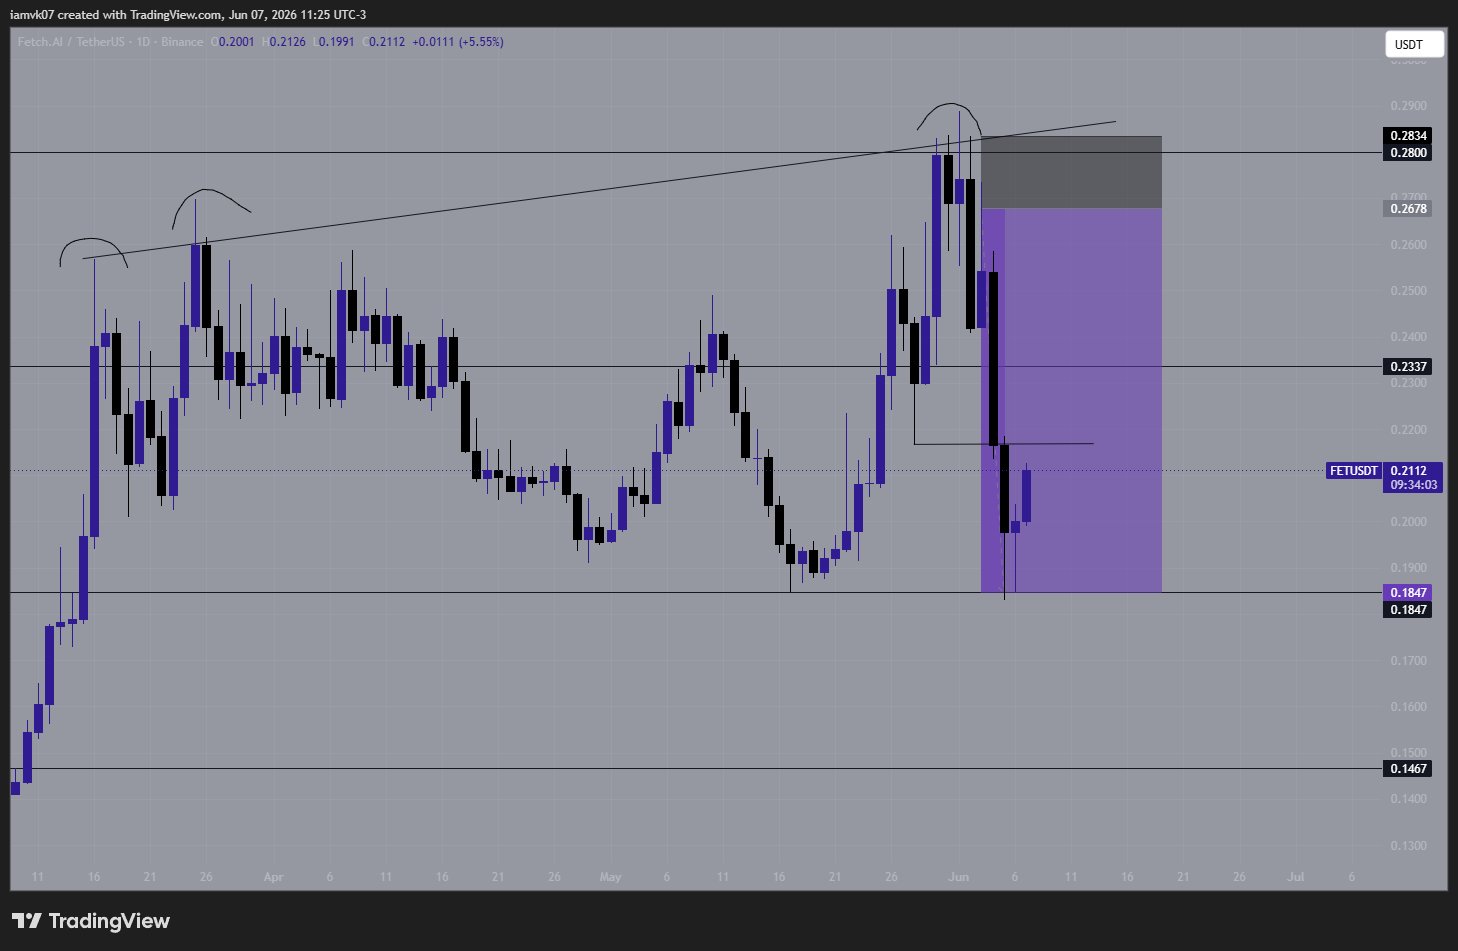
 76 8 3.76K أصلي >اتجاه FET بعد الإصدارمتصاعد بقوة
- اتجاه FET بعد الإصدارهابط
- اتجاه FET بعد الإصدارصاعد
 Blockchainedbb TA_Analyst Trader B226.49K @blockchainedbb
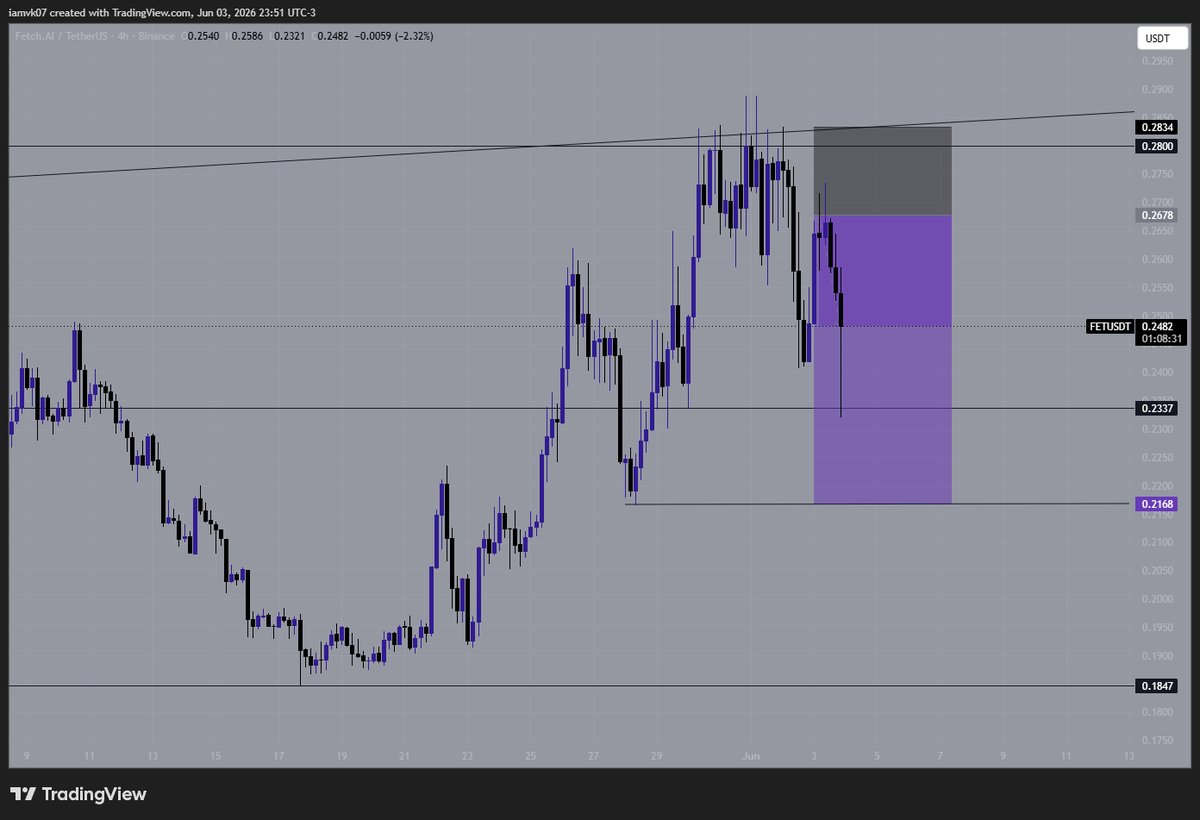
 Inzaghi D1.41K @Cryptosai8952 18 9.12K أصلي >اتجاه FET بعد الإصدارصاعد
 JAVON⚡️MARKS TA_Analyst Influencer B62.09K @JavonTM1
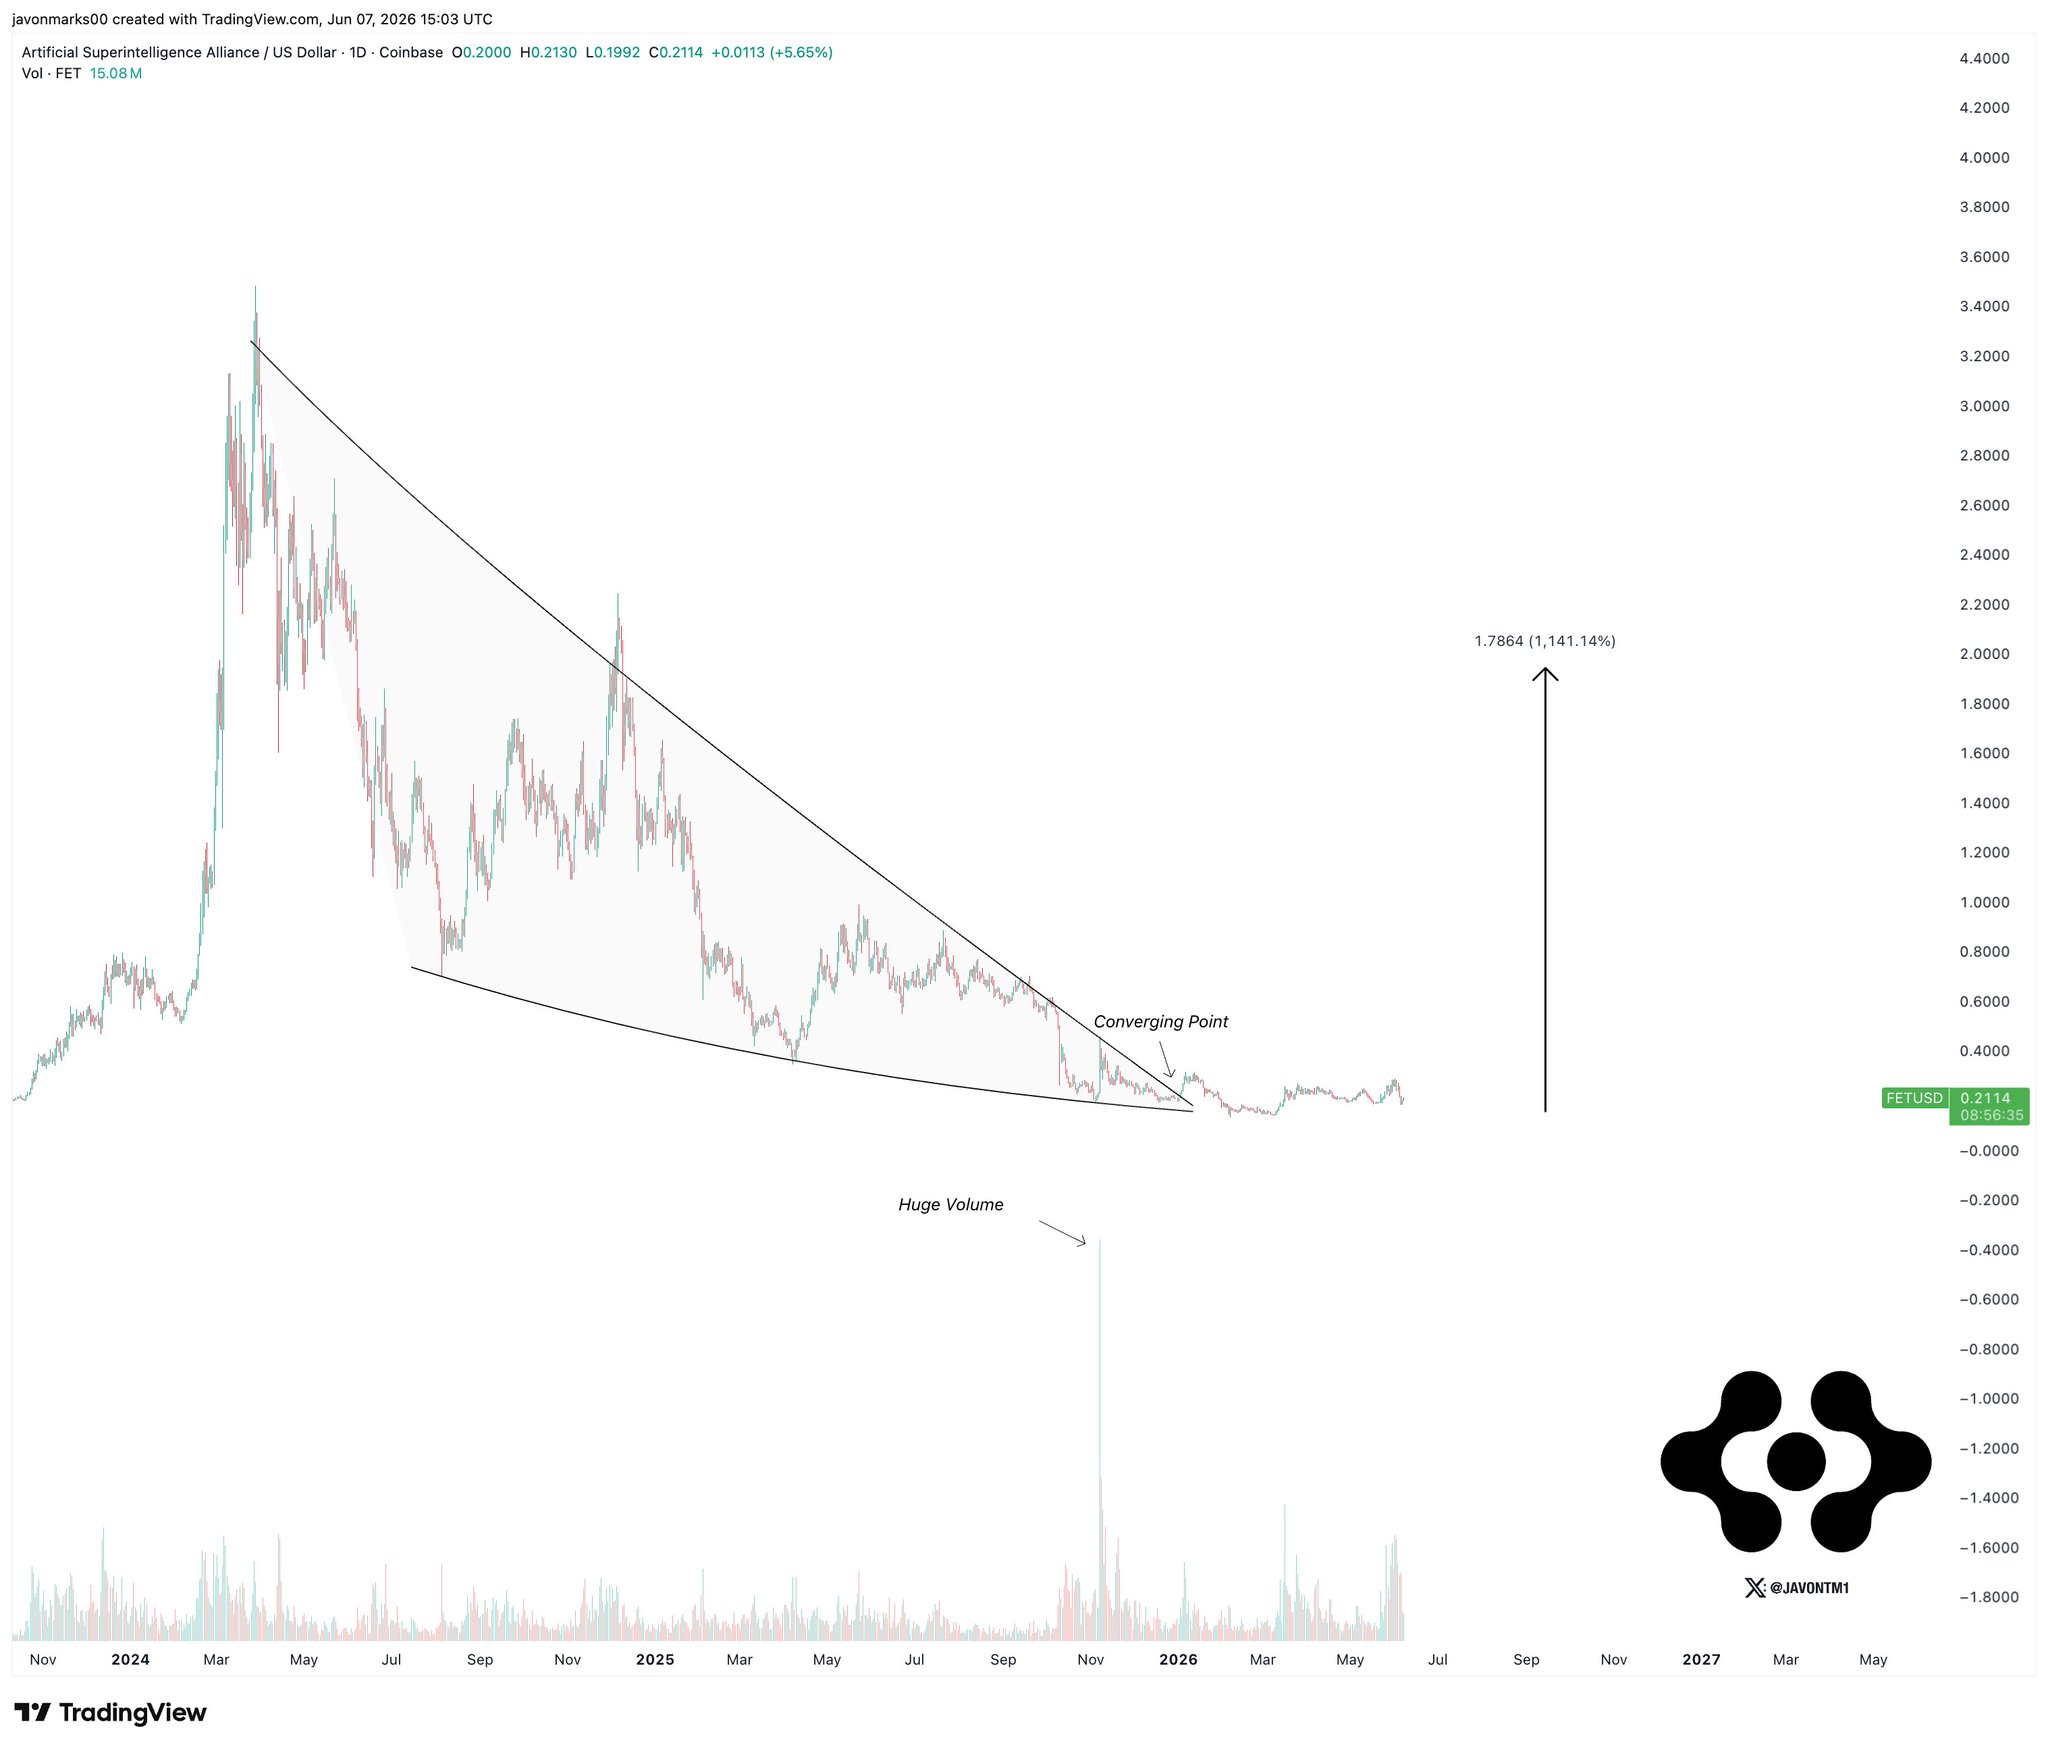 JAVON⚡️MARKS TA_Analyst Influencer B62.09K @JavonTM1
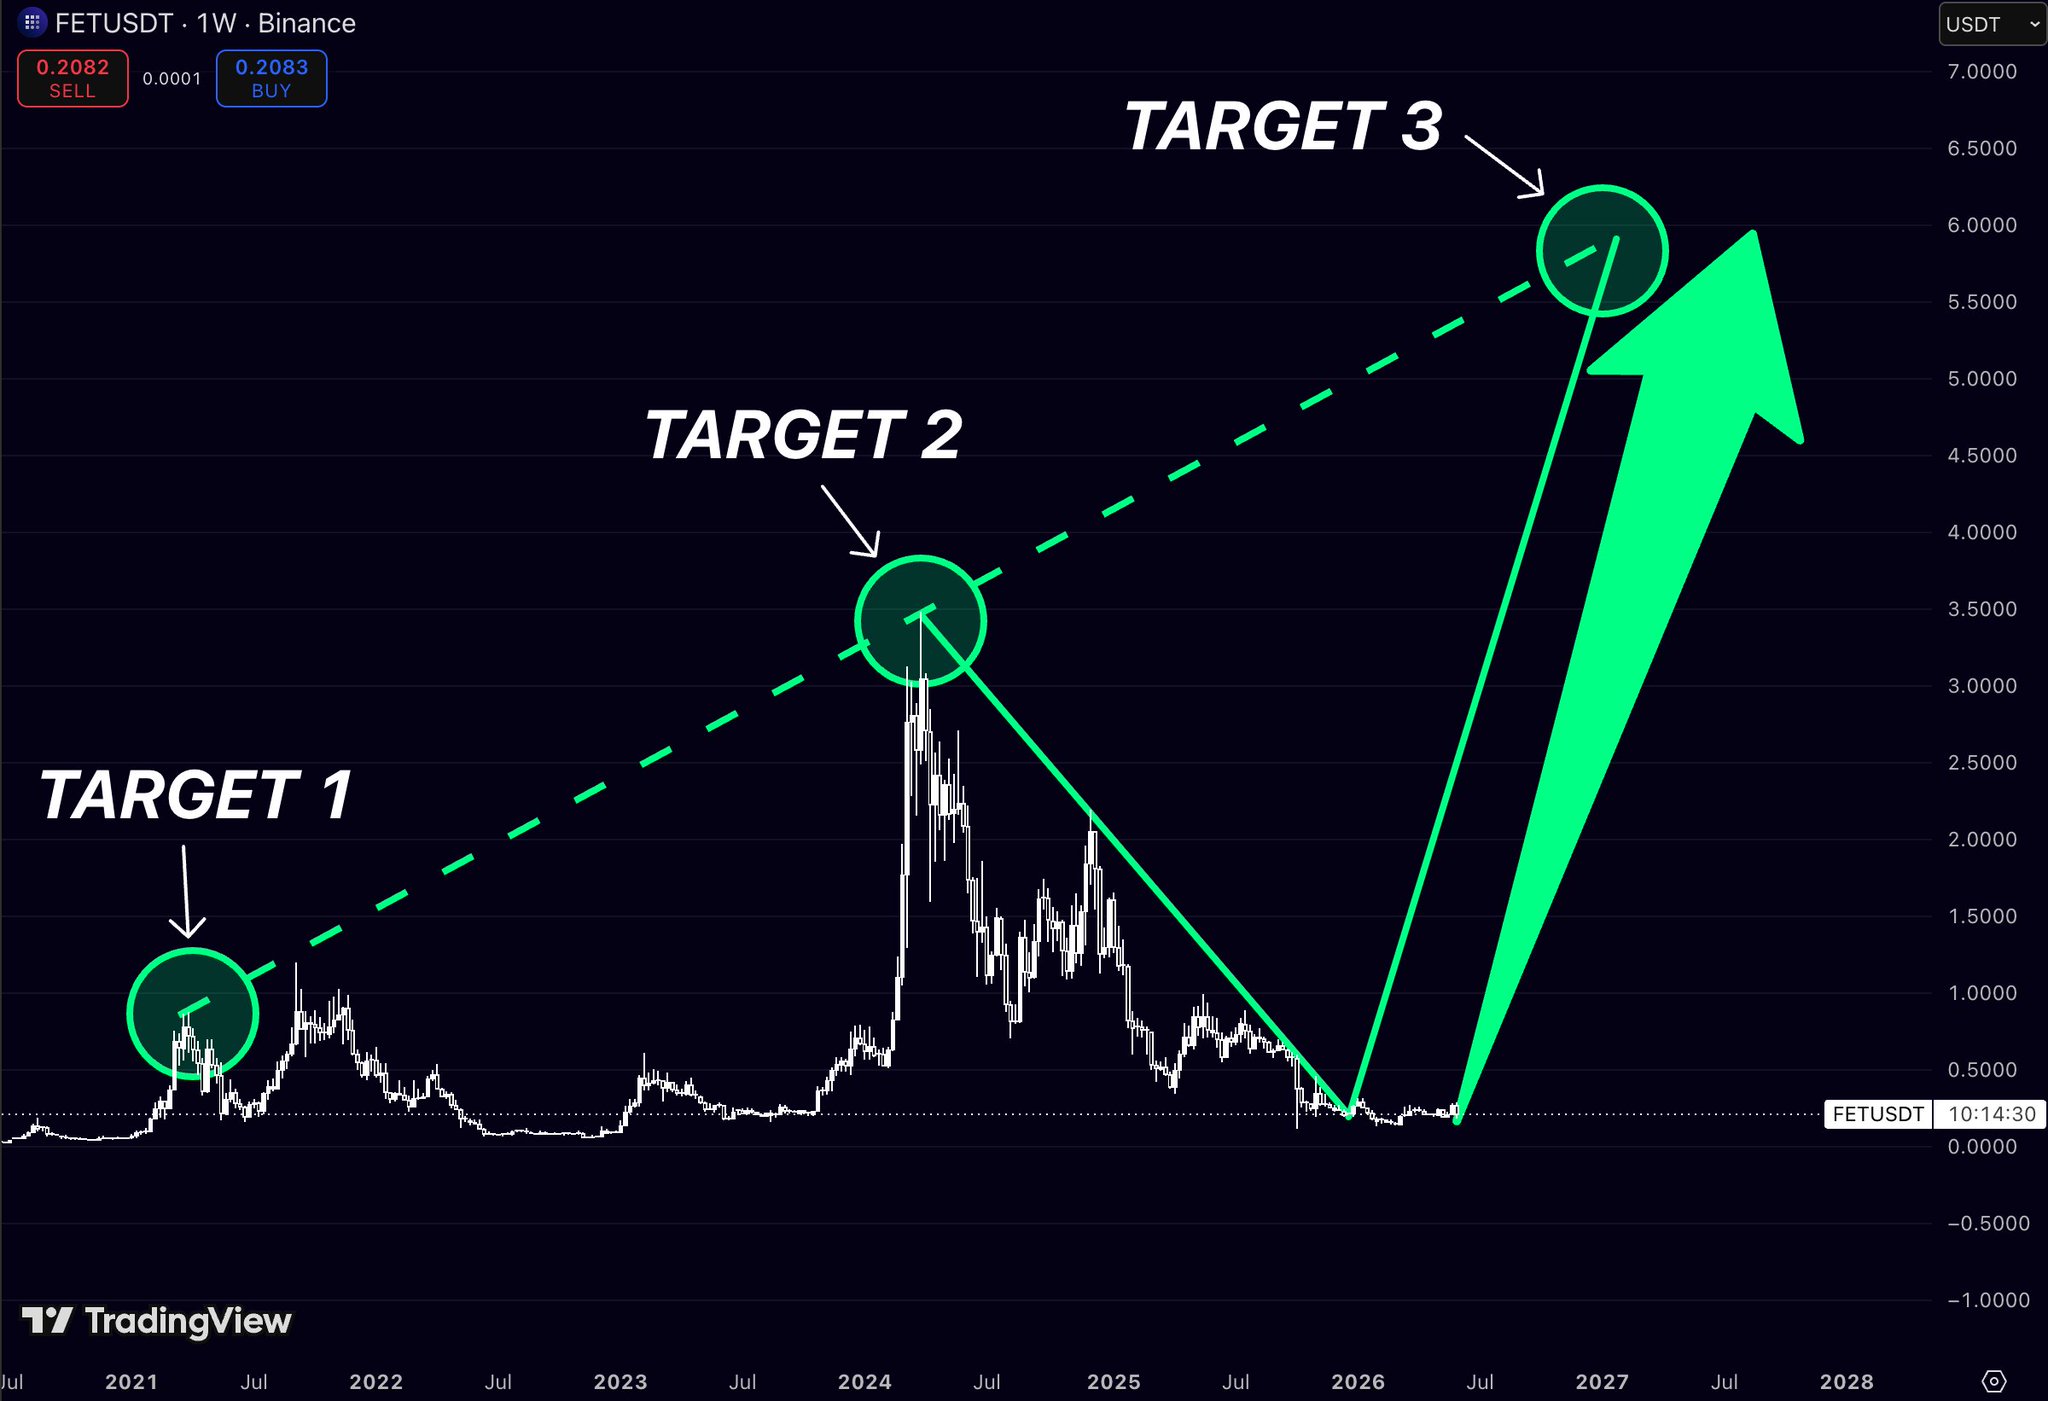
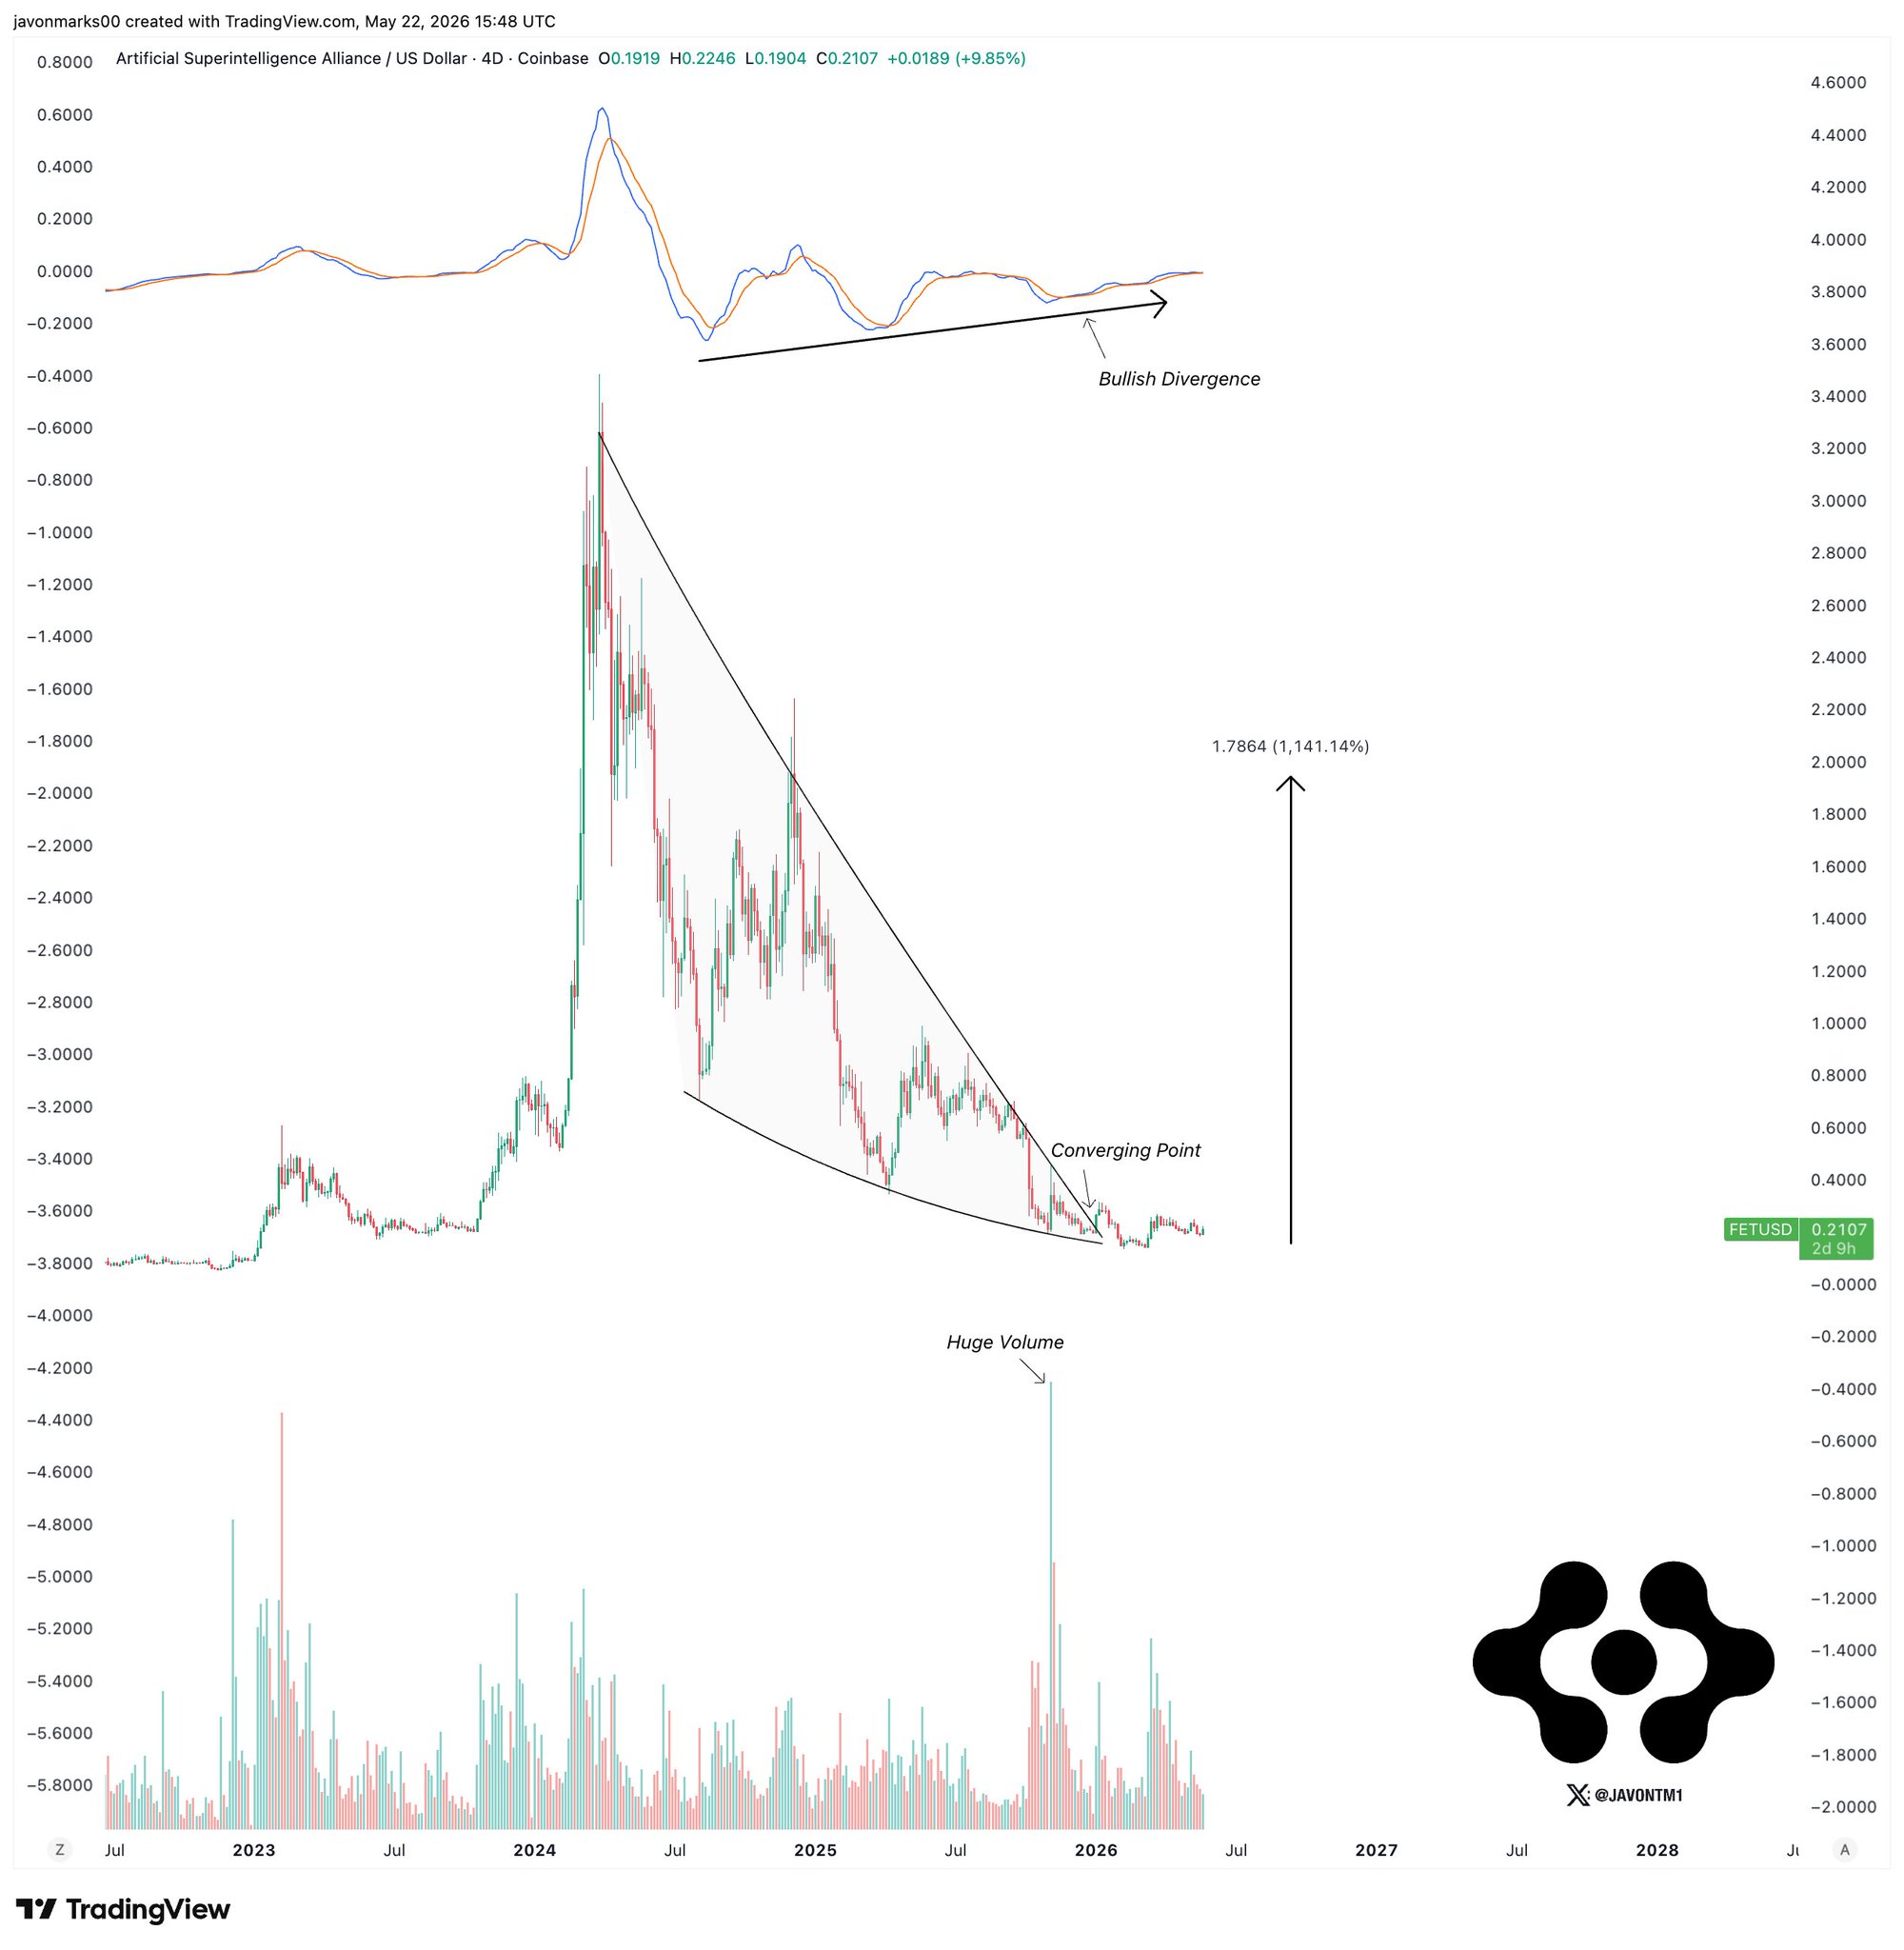 49 1 4.11K أصلي >اتجاه FET بعد الإصدارمتصاعد بقوة
- اتجاه FET بعد الإصدارمتصاعد بقوة
 OCT Trades TA_Analyst Trader B5.23K @oct_trades
 Our Crypto Talk Media OnChain_Analyst C79.65K @ourcryptotalk
 36 4 3.10K أصلي >اتجاه FET بعد الإصدارمتصاعد بقوة
- اتجاه FET بعد الإصدارمتصاعد بقوة
- اتجاه FET بعد الإصدارمتصاعد بقوة
- اتجاه FET بعد الإصدارمحايد